

Introduction
Sorry it has taken me so long to write this post! The last post on the blog was October 19th – almost 6 weeks ago. Life happens. We have a 15 month old running around and she is a handful!
March 2024 update – we now have a 1.5 year old AND the 15 month old is 3.5 years old! Link to the next post in this series – Adding some polish to the X-Plane Python Autopilot with Flask, Redis, and WebSockets
Anyways, back to the current topic – coding a pitch/roll (2 axis) autopilot in X-Plane with Python with altitude and heading hold. Today we will be adding the following:
- Real-time graphing for 6 parameters
- Additional method to grab data out of X-Plane
- A normalize function to limit outputs to reasonable values
- Altitude preselect and hold function
The full code will be at the end of this post.
Video Link
coming soon
Contents
- Adding PyQtGraph
- Developing a normalize function
- Initializing the data structures to hold the graph values
- Defining the PyQtGraph window and parameters
- Getting more data points out of X-Plane
- Feeding the graph data structures with data
- Adding altitude preselect and hold
1 – Adding PyQtGraph
Pip is my preferred tool to manage Python packages. It is easy and works well. I initially tried graphing with MatPlotLib but it took 200-300ms to update, which really dragged down the control loop to the point of being unusable. Instead, we will be using PyQtGraph. Install it with Pip:
pip install pyqtgraph
2 – Developing a normalize function
This task is pretty straightforward. There are a couple places where we want to pass values that need to be within a certain range. The first example is to the client.sendCTRL() method to set the control surfaces in X-Plane. The documentation states values are expected to be from -1 to 1. I have got some really weird results sending values outside that range (specifically for throttle, if you send something like 4, you can end up with 400% throttle which is wayyy more than the engines can actually output).
# this function takes an input and either passes it through or adjusts
# the input to fit within the specified max/min values
def normalize(value, min=-1, max=1):
	# if value = 700, and max = 20, return 20
	# if value = -200, and min = -20, return -20
	if (value > max):
		return max
	elif (value < min):
		return min
	else:
		return value
3 – Initializing the graphing data structures
We need a couple of arrays to store the data for our graphs. We need (desired data to plot) + 1 arrays. The +1 is the x-axis, which will just store values like 0,1,2,3,etc. The others will be the y-values. We haven’t added the altitude stuff yet, so you can add them but they won’t be used yet.
x_axis_counters = [] #0, 1, 2, 3, etc. just basic x-axis values used for plotting
roll_history = []
pitch_history = []
#altitude_history = []
roll_setpoint_history = []
pitch_setpoint_history = []
#altitude_setpoint_history = []
plot_array_max_length = 100 # how many data points to hold in our arrays and graph
i = 1 # initialize x_axis_counter
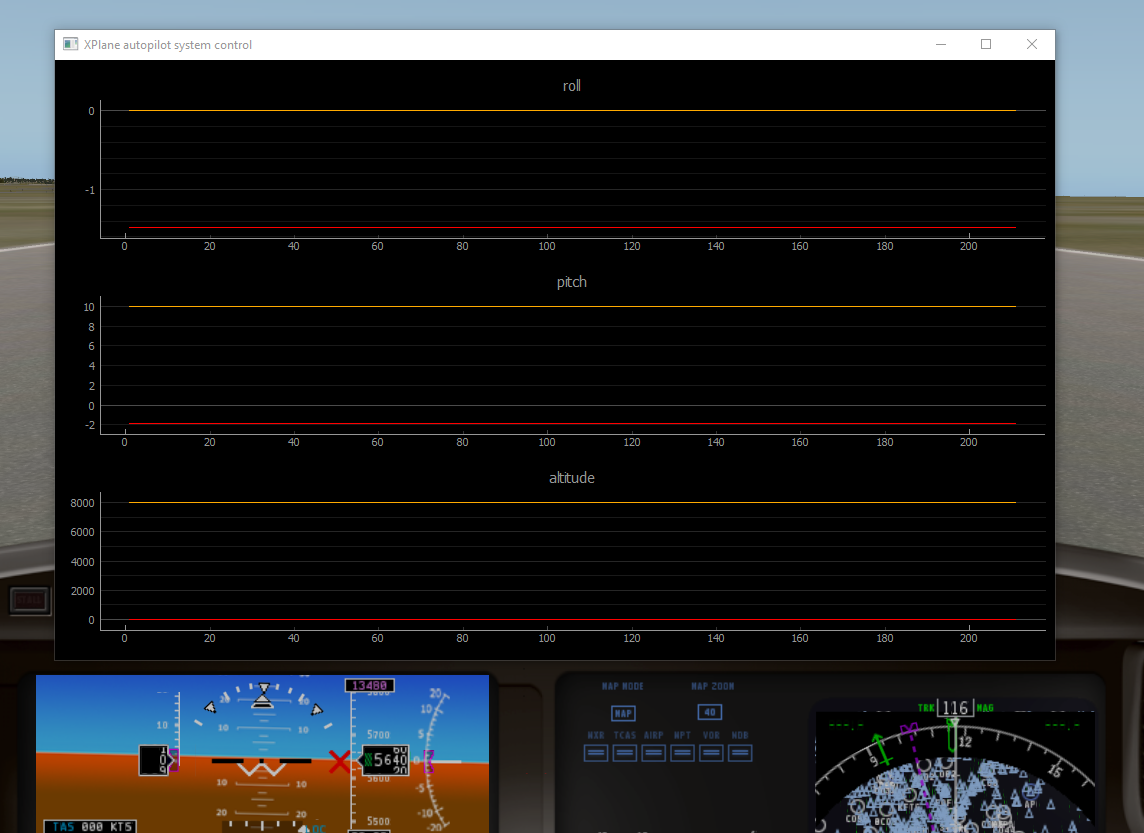
4 – Defining the PyQtGraph window and parameters
Working with PyQtGraph more or less means we’ll be working with a full blown GUI (just stripped down).
# first the base app needs to be instantiated
app = pg.mkQApp("python xplane autopilot monitor")

# now the window itself is defined and sized
win = pg.GraphicsLayoutWidget(show=True)
win.resize(1000,600) #pixels
win.setWindowTitle("XPlane autopilot system control")

# we have 3 subplots
p1 = win.addPlot(title="roll",row=0,col=0)
p2 = win.addPlot(title="pitch",row=1,col=0)
p3 = win.addPlot(title="altitude", row=2, col=0)

# show the y grid lines to make it easier to interpret the graphs
p1.showGrid(y=True)
p2.showGrid(y=True)
p3.showGrid(y=True)
5 – Getting more data points out of X-Plane
The initial .getPOSI() method that came in the example has worked well for us so far. But at this point we need more data that isn’t available in the .getPOSI() method. We will be utilizing a different method called .getDREFs() which is short for ‘get data references’. We will need to construct a list of data references we want to retrieve, pass that list to the method, and then parse the output. It is more granular than .getPOSI(). I haven’t evaluated the performance but I don’t think it is a problem.
The DREFs we want are for indicated airspeed, magnetic heading (.getPOSI() has true heading, not magnetic), an indicator to show if we are on the ground or not, and height as understood by the flight model. Thus, we can define our DREFs as follows:
DREFs = ["sim/cockpit2/gauges/indicators/airspeed_kts_pilot",
		"sim/cockpit2/gauges/indicators/heading_electric_deg_mag_pilot",
		"sim/flightmodel/failures/onground_any",
		"sim/flightmodel/misc/h_ind"]
And we can get the data with client.getDREFs(DREFs). The returned object is a 2d array. We need to parse out our values of interest. The full data gathering code looks like this:
posi = client.getPOSI();
ctrl = client.getCTRL();
multi_DREFs = client.getDREFs(DREFs)

current_roll = posi[4]
current_pitch = posi[3]
current_hdg = multi_DREFs[1][0]
current_altitude = multi_DREFs[3][0]
current_asi = multi_DREFs[0][0]
onground = multi_DREFs[2][0]
With those data points, we have everything we need to start plotting the state of our aircraft and monitoring for PID tuning.
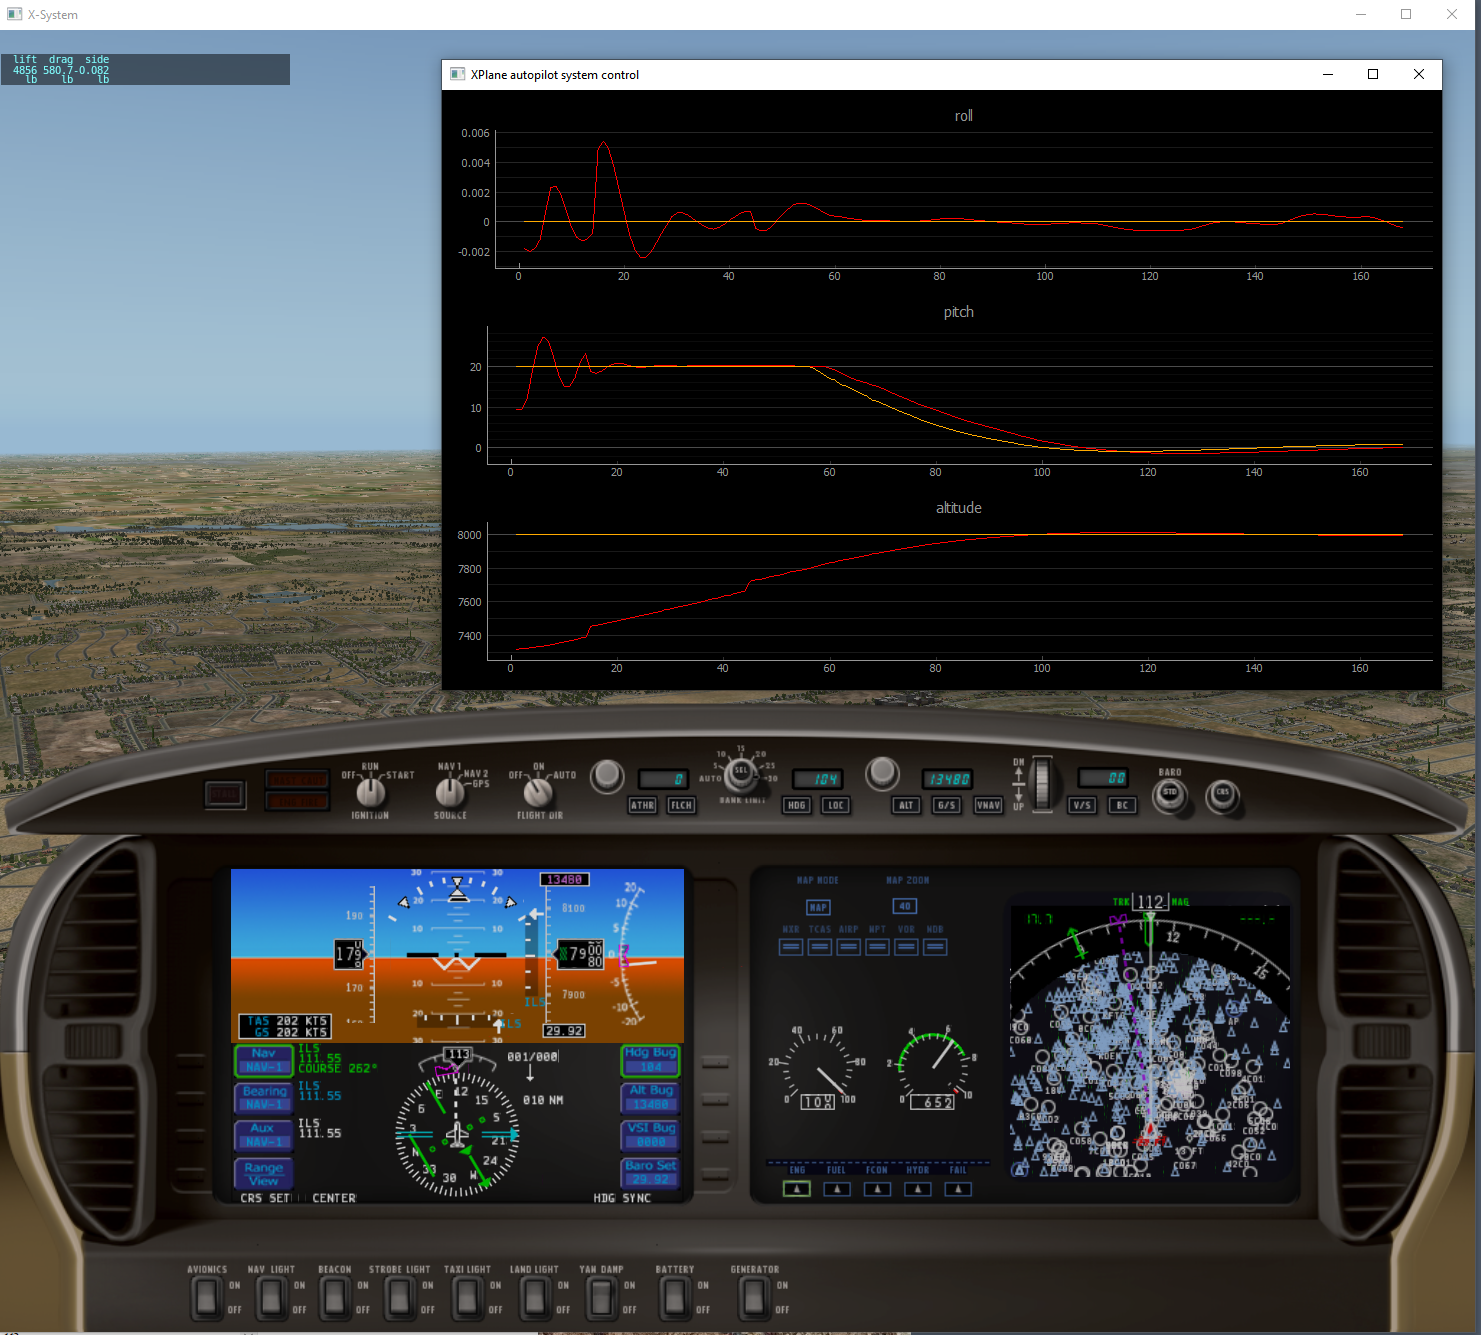
6 – Feeding the real-time graphs with data
Next up is actually adding data to be plotted. There are two scenarios to consider when adding data to the arrays: 1) the arrays have not yet reached the limit we set earlier (100 points), and 2) they have. Case 1 is easy. We just append the current values to the arrays:
x_axis_counters.append(i)
roll_history.append(current_roll)
roll_setpoint_history.append(desired_roll)
pitch_history.append(current_pitch)
pitch_setpoint_history.append(pitch_PID.SetPoint)
altitude_history.append(current_altitude)
altitude_setpoint_history.append(desired_altitude)
The above code will work perfectly fine if you want the arrays to grow infinitely large over time. Ain’t nobody got time for that so we need to check how long the arrays are and delete data. We’ll check the length of the x-axis array as a proxy for all the others and use that to determine what to do. Typing this code that looks very similar over and over again means it’s probably time to abstract it into classes or something else. The more you type something over and over again, the larger indication you have that you need to so something about it. But for now we’ll leave it like this for ease of reading and comprehension.
# if we reach our data limit set point, evict old data and add new.
# this helps keep the graph clean and prevents it from growing infinitely
if(len(x_axis_counters) > plot_array_max_length):
	x_axis_counters.pop(0)
	roll_history.pop(0)
	roll_setpoint_history.pop(0)
	pitch_history.pop(0)
	pitch_setpoint_history.pop(0)
	altitude_history.pop(0)
	altitude_setpoint_history.pop(0)

	x_axis_counters.append(i)
	roll_history.append(current_roll)
	roll_setpoint_history.append(desired_roll)
	pitch_history.append(current_pitch)
	pitch_setpoint_history.append(pitch_PID.SetPoint)
	altitude_history.append(current_altitude)
	altitude_setpoint_history.append(desired_altitude)
# else, just add new. we are not yet at limit.
else:
	x_axis_counters.append(i)
	roll_history.append(current_roll)
	roll_setpoint_history.append(desired_roll)
	pitch_history.append(current_pitch)
	pitch_setpoint_history.append(pitch_PID.SetPoint)
	altitude_history.append(current_altitude)
	altitude_setpoint_history.append(desired_altitude)
i = i + 1
You will notice that there are quite a few entries for altitude. We haven’t done anything with that yet so just set desired_altitude to an integer somewhere in the code so it doesn’t error out.
To complete the graphing portion, we need to actually plot the data. The clear=true in the below lines clears out the plot so we’re not replotting on top of the old data. We also need to process events to actually draw the graph:
# process events means draw the graphs
pg.QtGui.QApplication.processEvents()

# arguments are x values, y values, options
# pen is a different line in the plot
p1.plot(x_axis_counters, roll_history, pen=0, clear=True)
p1.plot(x_axis_counters, roll_setpoint_history, pen=1)

p2.plot(x_axis_counters, pitch_history, pen=0,clear=True)
p2.plot(x_axis_counters, pitch_setpoint_history, pen=1)

p3.plot(x_axis_counters, altitude_history, pen=0,clear=True)
p3.plot(x_axis_counters, altitude_setpoint_history, pen=1)
You can now run the code to see your graph populating with data!
7 – Adding altitude autopilot (preselect and hold)
Ok so now that we have eye candy with the real-time graphs, we can make our autopilot do something useful: go to a selected altitude and hold it.
We already have the roll and pitch PIDs functioning as desired. How do we couple the pitch PID to get to the desired altitude? One cannot directly control altitude. Altitude is controlled via a combination of pitch and airspeed (and time).
We will call the coupled PIDs an inner loop (pitch) and an outer loop (altitude). The outer loop runs and its output will feed the input of the inner loop. The altitude PID will be fed a desired altitude and current altitude. The output will then mostly be the error (desired altitude – current altitude) multiplied by our P setting. Of course I and D will have a say in the output but by and large it will be some proportion of the error.
Let’s start with defining the altitude PID and desired altitude:
altitude_PID = PID.PID(P, I, D)
desired_altitude = 8000
altitude_PID.SetPoint = desired_altitude
With those defined, we now move to the main loop. The outer loop needs to be updated first. From there, we will normalize the output from the altitude PID and use that to set the pitch PID. The pitch PID will also be normalized to keep values in a reasonable range:
# update outer loops first
altitude_PID.update(current_altitude)

# if alt=12000, setpoint = 10000, the error is 2000. if P=0.1, output will be 2000*0.1=200
pitch_PID.SetPoint = normalize(altitude_PID.output, min=-15, max=10)

# update PIDs
roll_PID.update(current_roll)
pitch_PID.update(current_pitch)

# update control outputs
new_ail_ctrl = normalize(roll_PID.output)
new_ele_ctrl = normalize(pitch_PID.output)
Now we just need to send those new control surface commands and we’ll be controlling the plane!
Outputting the control deflections should basically be the last part of the loop. We’ll put it right before the debug output:
# sending actual control values to XPlane
ctrl = [new_ele_ctrl, new_ail_ctrl, 0.0, -998] # ele, ail, rud, thr. -998 means don't change
client.sendCTRL(ctrl)
Full code of pitch_roll_autopilot_with_graphing.py
import sys
import xpc
import PID
from datetime import datetime, timedelta
import pyqtgraph as pg
from pyqtgraph.Qt import QtCore, QtGui
import time

def normalize(value, min=-1, max=1):
	# if value = 700, and max = 20, return 20
	# if value = -200, and min = -20, return -20
	if (value > max):
		return max
	elif (value < min):
		return min
	else:
		return value

update_interval = 0.050 # seconds, 0.05 = 20 Hz
start = datetime.now()
last_update = start

# defining the initial PID values
P = 0.1 # PID library default = 0.2
I = P/10 # default = 0
D = 0 # default = 0

# initializing PID controllers
roll_PID = PID.PID(P, I, D)
pitch_PID = PID.PID(P, I, D)
altitude_PID = PID.PID(P, I, D)

# setting the desired values
# roll = 0 means wings level
# pitch = 2 means slightly nose up, which is required for level flight
desired_roll = 0
desired_pitch = 2
desired_altitude = 8000

# setting the PID set points with our desired values
roll_PID.SetPoint = desired_roll
pitch_PID.SetPoint = desired_pitch
altitude_PID.SetPoint = desired_altitude

x_axis_counters = [] #0, 1, 2, 3, etc. just basic x-axis values used for plotting
roll_history = []
pitch_history = []
altitude_history = []
roll_setpoint_history = []
pitch_setpoint_history = []
altitude_setpoint_history = []
plot_array_max_length = 300 # how many data points to hold in our arrays and graph
i = 1 # initialize x_axis_counter

# first the base app needs to be instantiated
app = pg.mkQApp("python xplane autopilot monitor")

# now the window itself is defined and sized
win = pg.GraphicsLayoutWidget(show=True)
win.resize(1000,600) #pixels
win.setWindowTitle("XPlane autopilot system control")

# we have 3 subplots
p1 = win.addPlot(title="roll",row=0,col=0)
p2 = win.addPlot(title="pitch",row=1,col=0)
p3 = win.addPlot(title="altitude", row=2, col=0)

# show the y grid lines to make it easier to interpret the graphs
p1.showGrid(y=True)
p2.showGrid(y=True)
p3.showGrid(y=True)

DREFs = ["sim/cockpit2/gauges/indicators/airspeed_kts_pilot",
		"sim/cockpit2/gauges/indicators/heading_electric_deg_mag_pilot",
		"sim/flightmodel/failures/onground_any",
		"sim/flightmodel/misc/h_ind"]

def monitor():
	global i
	global last_update
	with xpc.XPlaneConnect() as client:
		while True:
			if (datetime.now() > last_update + timedelta(milliseconds = update_interval * 1000)):
				last_update = datetime.now()
				print(f"loop start - {datetime.now()}")

				posi = client.getPOSI();
				ctrl = client.getCTRL();
				multi_DREFs = client.getDREFs(DREFs)

				current_roll = posi[4]
				current_pitch = posi[3]
				current_hdg = multi_DREFs[1][0]
				current_altitude = multi_DREFs[3][0]
				current_asi = multi_DREFs[0][0]
				onground = multi_DREFs[2][0]

				# update the display
				pg.QtGui.QApplication.processEvents()

				# update outer loops first
				altitude_PID.update(current_altitude)

				# if alt=12000, setpoint = 10000, the error is 2000. if P=0.1, output will be 2000*0.1=200
				pitch_PID.SetPoint = normalize(altitude_PID.output, min=-15, max=10)

				# update PIDs
				roll_PID.update(current_roll)
				pitch_PID.update(current_pitch)

				# update control outputs
				new_ail_ctrl = normalize(roll_PID.output)
				new_ele_ctrl = normalize(pitch_PID.output)

				# if we reach our data limit set point, evict old data and add new.
				# this helps keep the graph clean and prevents it from growing infinitely
				if(len(x_axis_counters) > plot_array_max_length):
					x_axis_counters.pop(0)
					roll_history.pop(0)
					roll_setpoint_history.pop(0)
					pitch_history.pop(0)
					pitch_setpoint_history.pop(0)
					altitude_history.pop(0)
					altitude_setpoint_history.pop(0)

					x_axis_counters.append(i)
					roll_history.append(current_roll)
					roll_setpoint_history.append(desired_roll)
					pitch_history.append(current_pitch)
					pitch_setpoint_history.append(pitch_PID.SetPoint)
					altitude_history.append(0)
					altitude_setpoint_history.append(desired_altitude)
				# else, just add new. we are not yet at limit.
				else:
					x_axis_counters.append(i)
					roll_history.append(current_roll)
					roll_setpoint_history.append(desired_roll)
					pitch_history.append(current_pitch)
					pitch_setpoint_history.append(pitch_PID.SetPoint)
					altitude_history.append(0)
					altitude_setpoint_history.append(desired_altitude)
				i = i + 1

				p1.plot(x_axis_counters, roll_history, pen=0, clear=True)
				p1.plot(x_axis_counters, roll_setpoint_history, pen=1)

				p2.plot(x_axis_counters, pitch_history, pen=0,clear=True)
				p2.plot(x_axis_counters, pitch_setpoint_history, pen=1)

				p3.plot(x_axis_counters, altitude_history, pen=0,clear=True)
				p3.plot(x_axis_counters, altitude_setpoint_history, pen=1)

				# sending actual control values to XPlane
				ctrl = [new_ele_ctrl, new_ail_ctrl, 0.0, -998] # ele, ail, rud, thr. -998 means don't change
				client.sendCTRL(ctrl)

				output = f"current values --    roll: {current_roll: 0.3f},  pitch: {current_pitch: 0.3f}"
				output = output + "\n" + f"PID outputs    --    roll: {roll_PID.output: 0.3f},  pitch: {pitch_PID.output: 0.3f}"
				output = output + "\n"
				print(output)

if __name__ == "__main__":
	monitor()
Using the autopilot / Conclusion
To use the autopilot, fire up XPlane, hop in a small-ish plane (gross weight less than 10k lb), take off, climb 1000′, then execute the code. Your plane should bring roll to 0 pretty quick and start the climb/descent to the desired altitude.
9 replies on “Coding a pitch/roll/altitude autopilot in X-Plane with Python”
Nice post.
How could I make him follow a path (lat,long,alt,IAS)?
That is quite a bit more complicated. Continuing this series is next on my list though and following a path will be very high on the list of things to do.
This is a great tutorial series for developing an autopilot for X-Plane aircraft. I wonder if you have continued your work on implementing a flight path tracking function in this code?
Best,
Lars
I’m having one hell of a time also adding HDG/heading mode, since you can’t just “set the desired heading” anywhere, you have to set a roll value for “some time”, then zero it back out so you don’t roll over, so how would you use PID controllers to make heading mode work?
I did the next portion of the autopilot but haven’t posted about it yet. The secret is in nested PID loops with reasonable roll limits (e.g. limit the roll to -15,15 degrees). There is also some fun in determining whether to turn left or right. Sorry for the poor formatting below. I can send you the code to the email you used to post or on your github or wherever you want. Actually now that I’ve reviewed the code I’m not sure if the heading loop is fully implemented. Here’s the full code:
# https://onion.io/2bt-pid-control-python/

# https://github.com/ivmech/ivPID
import sys
import xpc
from datetime import datetime, timedelta
import PID
import time
import math, numpy
update_interval = 0.125 #seconds
start = datetime.now()
last_update = start
P = 0.05
I = 0.01
D = 0
desired_roll = 0 # init at flat and level - will be overridden by heading control
desired_pitch = 2 # init at flat and level - will be overridden by altitude control
desired_speed = 160
desired_alt = 8000.0
desired_hdg = 140
roll_PID = PID.PID(P*2, I*2, D)
roll_PID.SetPoint = desired_roll
pitch_PID = PID.PID(P, I, D)
pitch_PID.SetPoint = desired_pitch
altitude_PID = PID.PID(P*2, I*2, D)
altitude_PID.SetPoint = desired_alt
speed_PID = PID.PID(P, I, D)
speed_PID.SetPoint = desired_speed
heading_error_PID = PID.PID(1,0.05,0.1)
heading_error_PID.SetPoint = 0 # need heading error to be 0
DREFs = ["sim/cockpit2/gauges/indicators/airspeed_kts_pilot",
"sim/cockpit2/gauges/indicators/heading_electric_deg_mag_pilot",
"sim/flightmodel/failures/onground_any",
"sim/flightmodel/misc/h_ind"]
def normalize(value, min=-1, max=1):
if (value > max):
return max
elif (value = 180.0:
r -= 360.0
return r
# https://gist.github.com/jeromer/2005586
def get_bearing(pointA, pointB):
"""
Calculates the bearing between two points.
The formulae used is the following:
θ = atan2(sin(Δlong).cos(lat2),
cos(lat1).sin(lat2) − sin(lat1).cos(lat2).cos(Δlong))
:Parameters:
- `pointA: The tuple representing the latitude/longitude for the
first point. Latitude and longitude must be in decimal degrees
- `pointB: The tuple representing the latitude/longitude for the
second point. Latitude and longitude must be in decimal degrees
:Returns:
The bearing in degrees
:Returns Type:
float
"""
if (type(pointA) != tuple) or (type(pointB) != tuple):
raise TypeError("Only tuples are supported as arguments")
lat1 = math.radians(pointA[0])
lat2 = math.radians(pointB[0])
diffLong = math.radians(pointB[1] - pointA[1])
x = math.sin(diffLong) * math.cos(lat2)
y = math.cos(lat1) * math.sin(lat2) - (math.sin(lat1)
* math.cos(lat2) * math.cos(diffLong))
initial_bearing = math.atan2(x, y)
# Now we have the initial bearing but math.atan2 return values
# from -180° to + 180° which is not what we want for a compass bearing
# The solution is to normalize the initial bearing as shown below
initial_bearing = math.degrees(initial_bearing)
compass_bearing = (initial_bearing + 360) % 360
return compass_bearing
# https://janakiev.com/blog/gps-points-distance-python/
def haversine(coord1, coord2):
R = 6372800 # Earth radius in meters
lat1, lon1 = coord1
lat2, lon2 = coord2
phi1, phi2 = math.radians(lat1), math.radians(lat2)
dphi = math.radians(lat2 - lat1)
dlambda = math.radians(lon2 - lon1)
a = math.sin(dphi/2)**2 + \
math.cos(phi1)*math.cos(phi2)*math.sin(dlambda/2)**2
return 2*R*math.atan2(math.sqrt(a), math.sqrt(1 - a))
KBJC_lat = 39.9088056
KBJC_lon = -105.1171944
def monitor():
global last_update
with xpc.XPlaneConnect() as client:
while True:
if (datetime.now() > last_update + timedelta(milliseconds=update_interval*1000)):
last_update = datetime.now()
print(f"loop start - {datetime.now()}")
posi = client.getPOSI()
ctrl = client.getCTRL()
bearing_to_kbjc = get_bearing((posi[0], posi[1]), (KBJC_lat, KBJC_lon))
dist_to_kbjc = haversine((posi[0], posi[1]), (KBJC_lat, KBJC_lon))
#desired_hdg = 116 #bearing_to_kbjc
multi_DREFs = client.getDREFs(DREFs) #speed=0, mag hdg=1, onground=2
#https://github.com/nasa/XPlaneConnect/wiki/getDREF
#speed_DREF = client.getDREF()
current_roll = posi[4]
current_pitch = posi[3]
#current_hdg = posi[5] # this is true, need to use DREF to get mag ''
current_hdg = multi_DREFs[1][0]
current_altitude = multi_DREFs[3][0]
current_asi = multi_DREFs[0][0]
onground = multi_DREFs[2][0]
heading_error = get_angle_difference(desired_hdg, current_hdg)
# outer loops first
altitude_PID.update(current_altitude)
heading_error_PID.update(heading_error)
# heading_PID, not yet implemented
new_pitch_from_altitude = normalize(altitude_PID.output, -10, 10)
new_roll_from_heading_error = normalize(heading_error_PID.output, -25, 25)
# if new_pitch_from_altitude > 15:
# new_pitch_from_altitude = 15
# elif new_pitch_from_altitude < -15:
# new_pitch_from_altitude = -15
pitch_PID.SetPoint = new_pitch_from_altitude
roll_PID.SetPoint = new_roll_from_heading_error
roll_PID.update(current_roll)
speed_PID.update(current_asi)
pitch_PID.update(current_pitch)
new_ail_ctrl = normalize(roll_PID.output, min=-1, max=1)
new_ele_ctrl = normalize(pitch_PID.output, min=-1, max=1)
new_thr_ctrl = normalize(speed_PID.output, min=0, max=1)
if (onground != 1.0):
ctrl = [new_ele_ctrl, new_ail_ctrl, 0.0, new_thr_ctrl] # ele, ail, rud, thr. -998 means don't change
client.sendCTRL(ctrl)
else:
print("on ground, not sending controls")
output = f"current values -- roll: {current_roll: 0.3f}, pitch: {current_pitch: 0.3f}, hdg: {current_hdg:0.3f}, alt: {current_altitude:0.3f}, asi: {current_asi:0.3f}"
output = output + "\n" + f"hdg error: {heading_error: 0.3f}"
output = output + "\n" + f"new ctrl positions -- ail: {new_ail_ctrl: 0.4f}, ele: {new_ele_ctrl: 0.4f}, thr: {new_thr_ctrl:0.4f}"
output = output + "\n" + f"PID outputs -- altitude: {altitude_PID.output: 0.4f}, pitch: {pitch_PID.output: 0.4f}, ail: {roll_PID.output: 0.3f}, hdg: {heading_error_PID.output: 0.3f}"
output = output + "\n" + f"bearing to KBJC: {bearing_to_kbjc:3.1f}, dist: {dist_to_kbjc*0.000539957:0.2f} NM"
output = output + "\n" + f"loop end - {datetime.now()}"
output = output + "\n"
print(output)
time.sleep(0.005)
if __name__ == "__main__":
monitor()
Thanks! I’m trying to add a simple autopilot using MSFS’s SimConnect and JS, but porting Python to or from JS is pretty trivial =)
I’m still having a whale of a time trying to not get it to horrendously overshoot. Even though the heading error itself gets smaller, the heading error update keeps getting bigger until we hit the target, so it takes forever for it to drop back down to where it changes sign, and finally forces the desired roll to flip to the opposite direction.
Look up each term of PID. The D portion is what you need to tune to prevent overshoot. Start with very small values (like a tenth of P or I). https://pidexplained.com/how-to-tune-a-pid-controller/
Tuning PID process control loops is a full-time job for many engineers – good luck!
[…] below is the main script (you’ll also need PID.py, which I borrowed a few years ago for the Coding a pitch/roll/altitude autopilot in X-Plane with Python series of posts). It can be run via SSH for debugging purposes (it is no fun to edit python via […]