Continuing from the last post (Adding some polish to the X-Plane Python Autopilot with Flask, Redis, and WebSockets), I have a bit of momentum going on the Python X-Plane Autopilot stuff. There were a couple of items I wanted to complete before declaring the project “done”. The first is a “takeoff” button, which isn’t yet done. The other is the ability to fly along a track. That is now complete as of last night.
It is one thing to fly a bearing from A to B. That works fine as long as there is no wind in any direction. Flying a heading set by bearing is easy, and is part of the heading select & hold feature built out in a previous iteration of the code. To do so requires a “desired heading” and a heading error PID. The goal is to minimize the heading error, so we set the setpoint to 0. This controls a “roll” PID controller, which controls an aileron PID controller.
Each have limits in place to prevent excessive movement. For example, the roll PID controller is limited to +/- 30 degrees. Pitch is +/- 15 degrees.
To take this to the next step requires a few things:
- A “track”, which is commonly defined as a start point and an end point. Both are simply lat/lon coordinate sets.
- A current location, which is current lat/lon
- A cross track distance (error), which is the distance the current location is off the track.
- More PID loops, namely a cross track distance PID control, which, like the heading error PID, has a setpoint of 0 (i.e. the goal is to minimize the cross track distance).
Additionally, to make something actually useful, we need a “database” of navigation points. I parsed the fixed-width delimited text files of X-Plane for this, which was not fun.
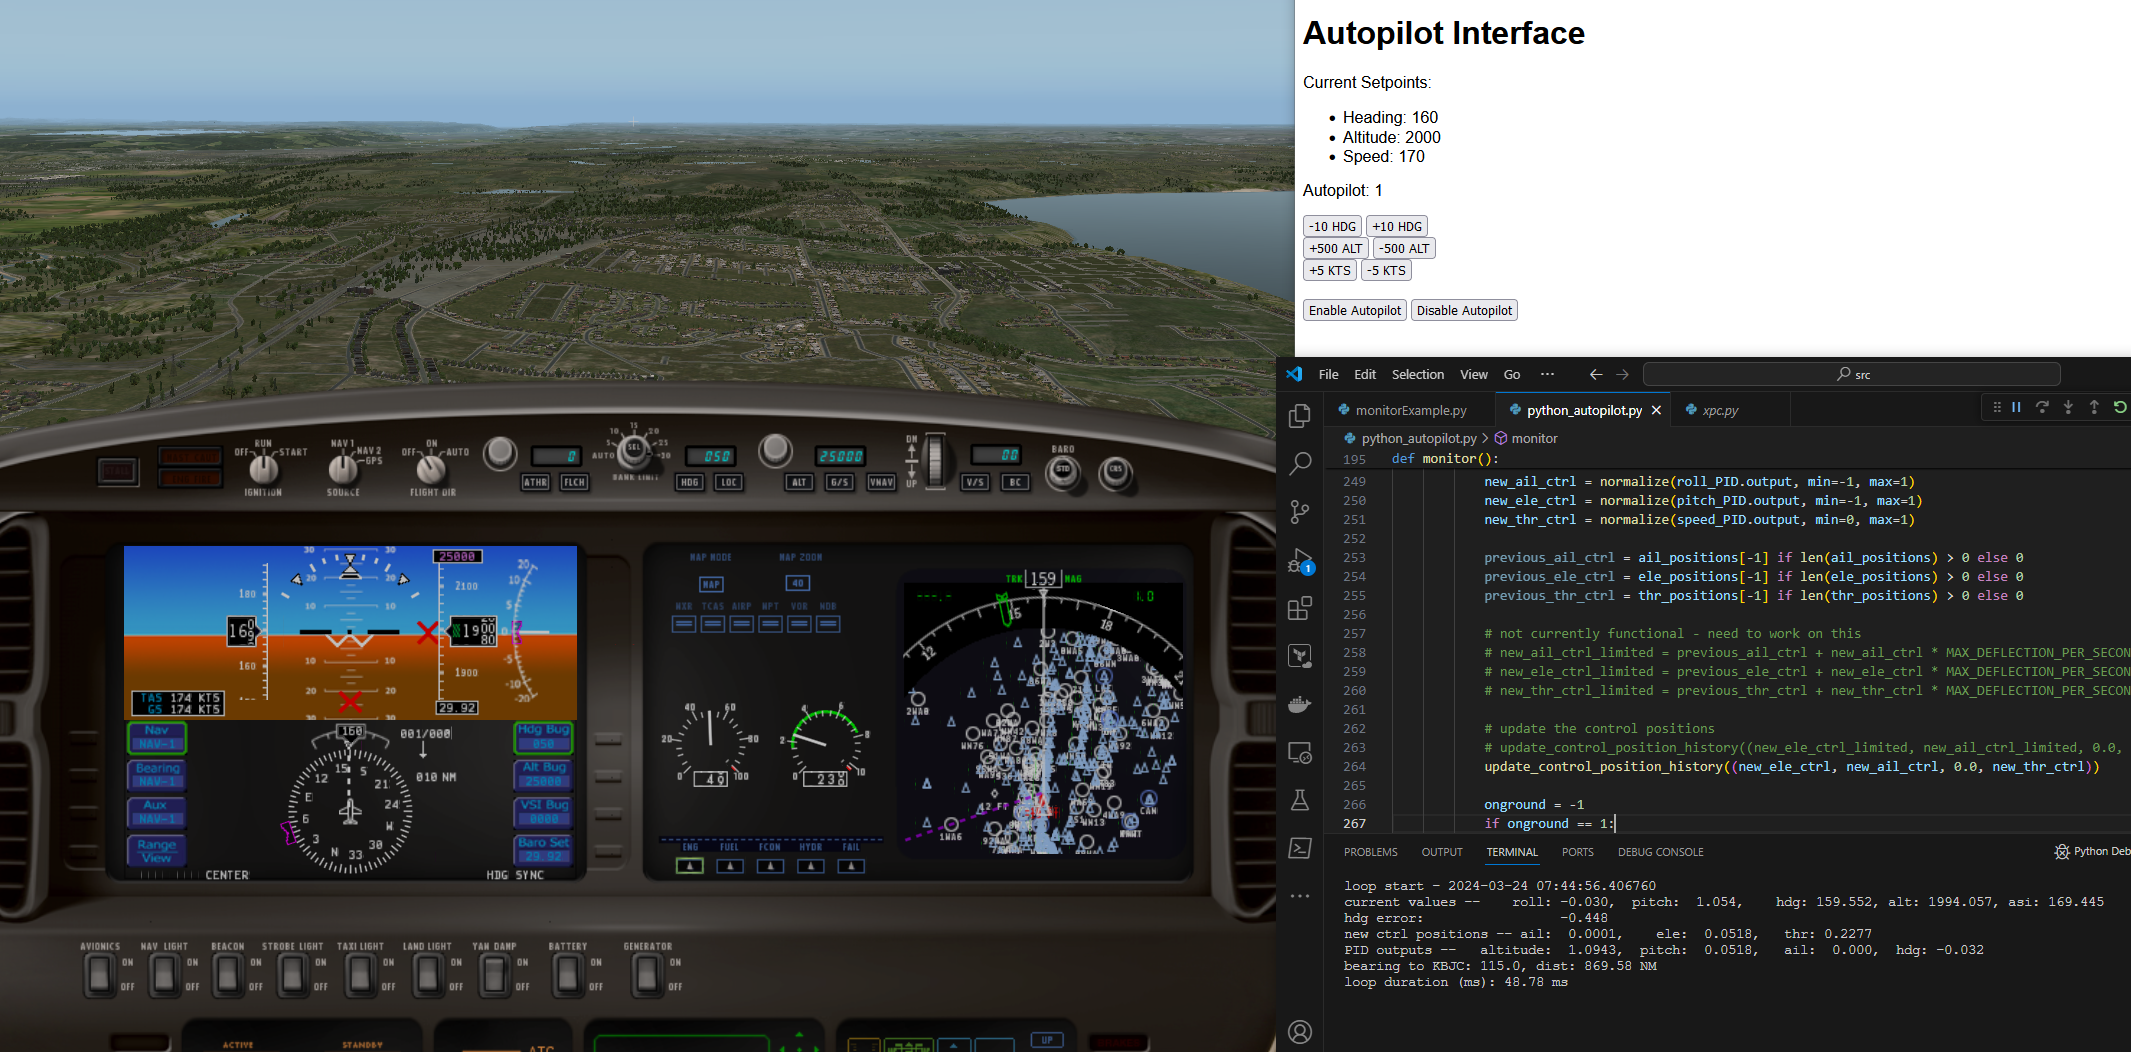
To tie it all together, the web interface needs a way to type in a nav point, and a Direct To (D->To) button. Direct to is common in aviation GPS units to set a track from the location when the button is pushed to some point (VOR, fix, airport, etc). I’ve emulated that functionality.
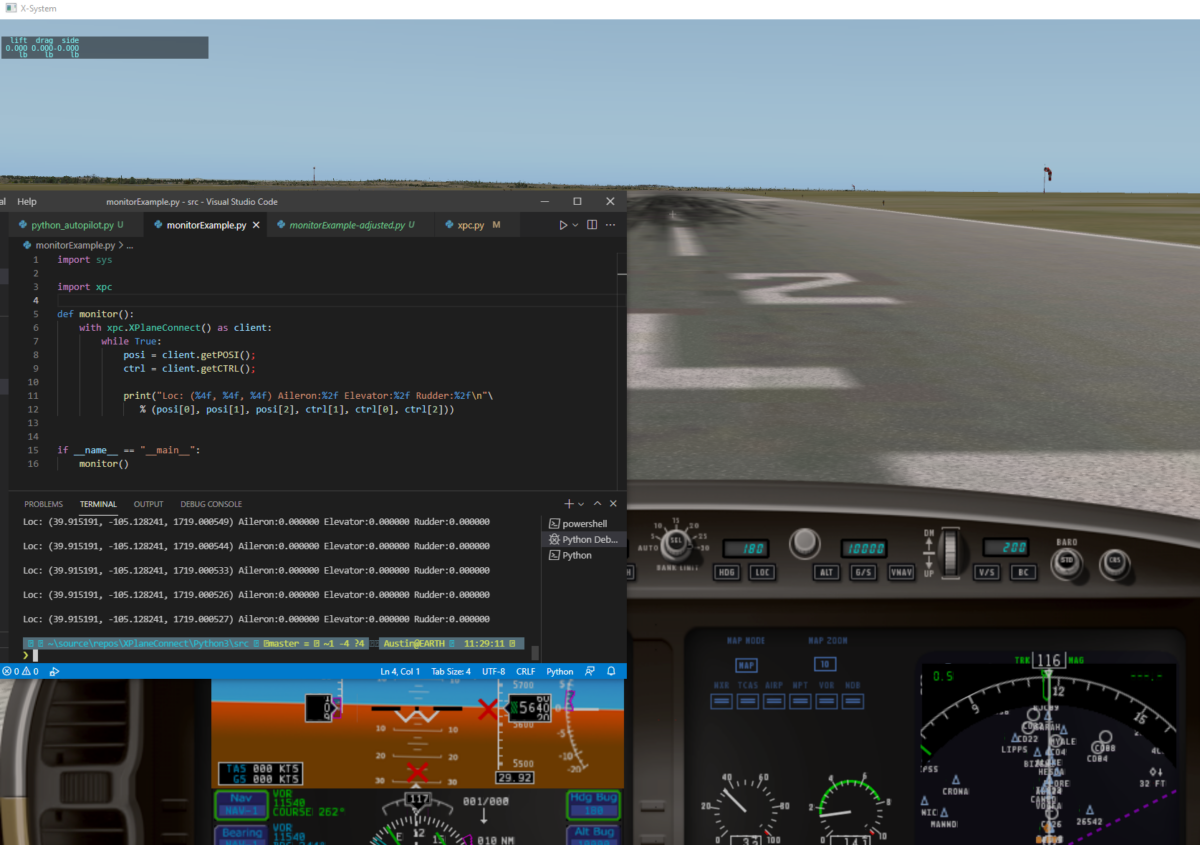
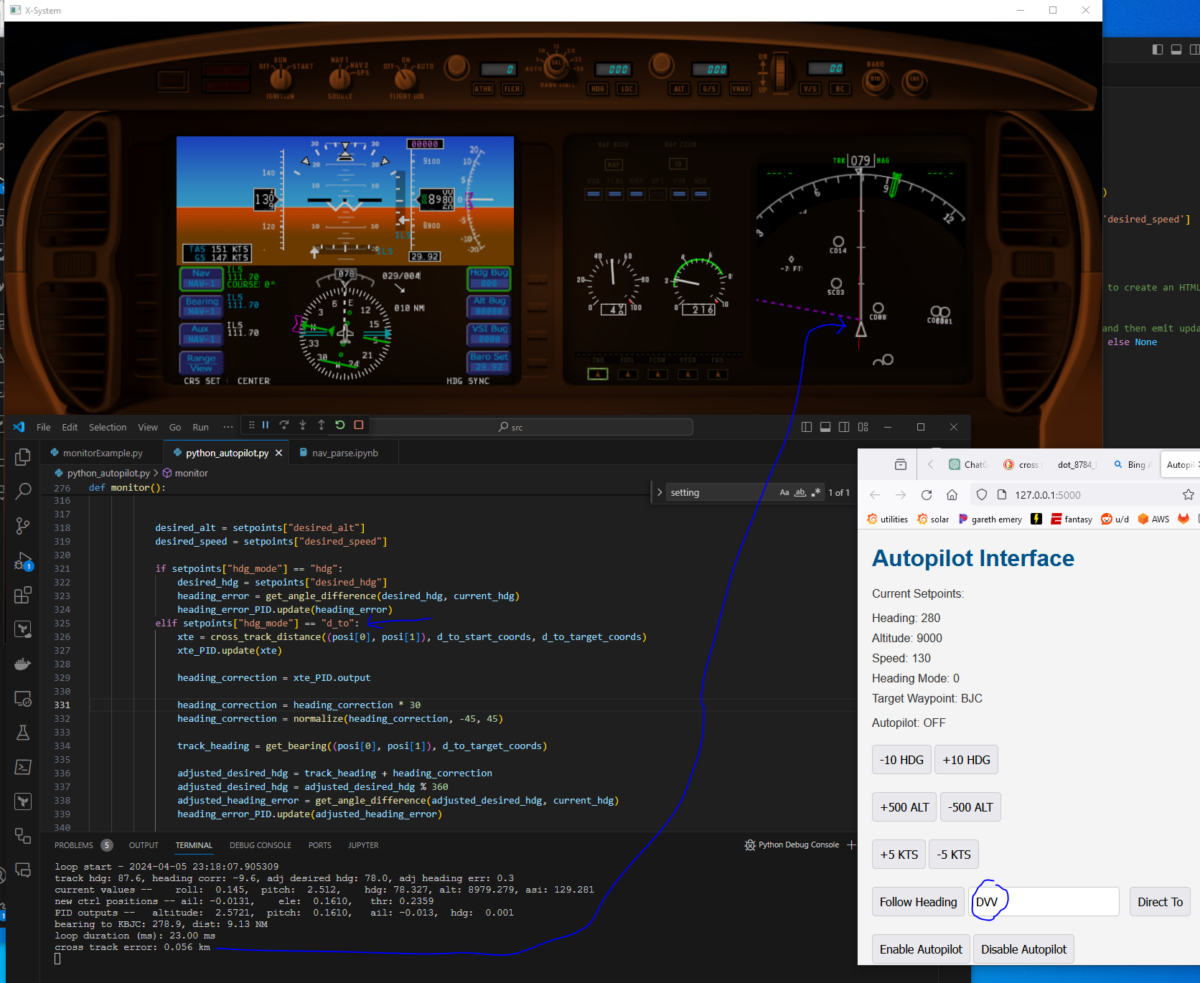
Here’s the screenshot showing the example aircraft navigating to DVV, which is the KDEN VOR, from somewhere near KBJC. It shows a cross track error of 0.056 km, or 56 meters. ChatGPT helpfully generated the cross track error function with a resultant number in meters. I am comfortable with many kinds of units so I’ll leave this for now. The red line on the right map view is the aircraft’s interpretation of the direct to set at the same time as I clicked my autopilot’s Direct To button. There is a 4 kt wind coming from 029. I tested with greater, somewhat constant crosswinds in the 40-50 kt range with gusts of +/- 5 kts.

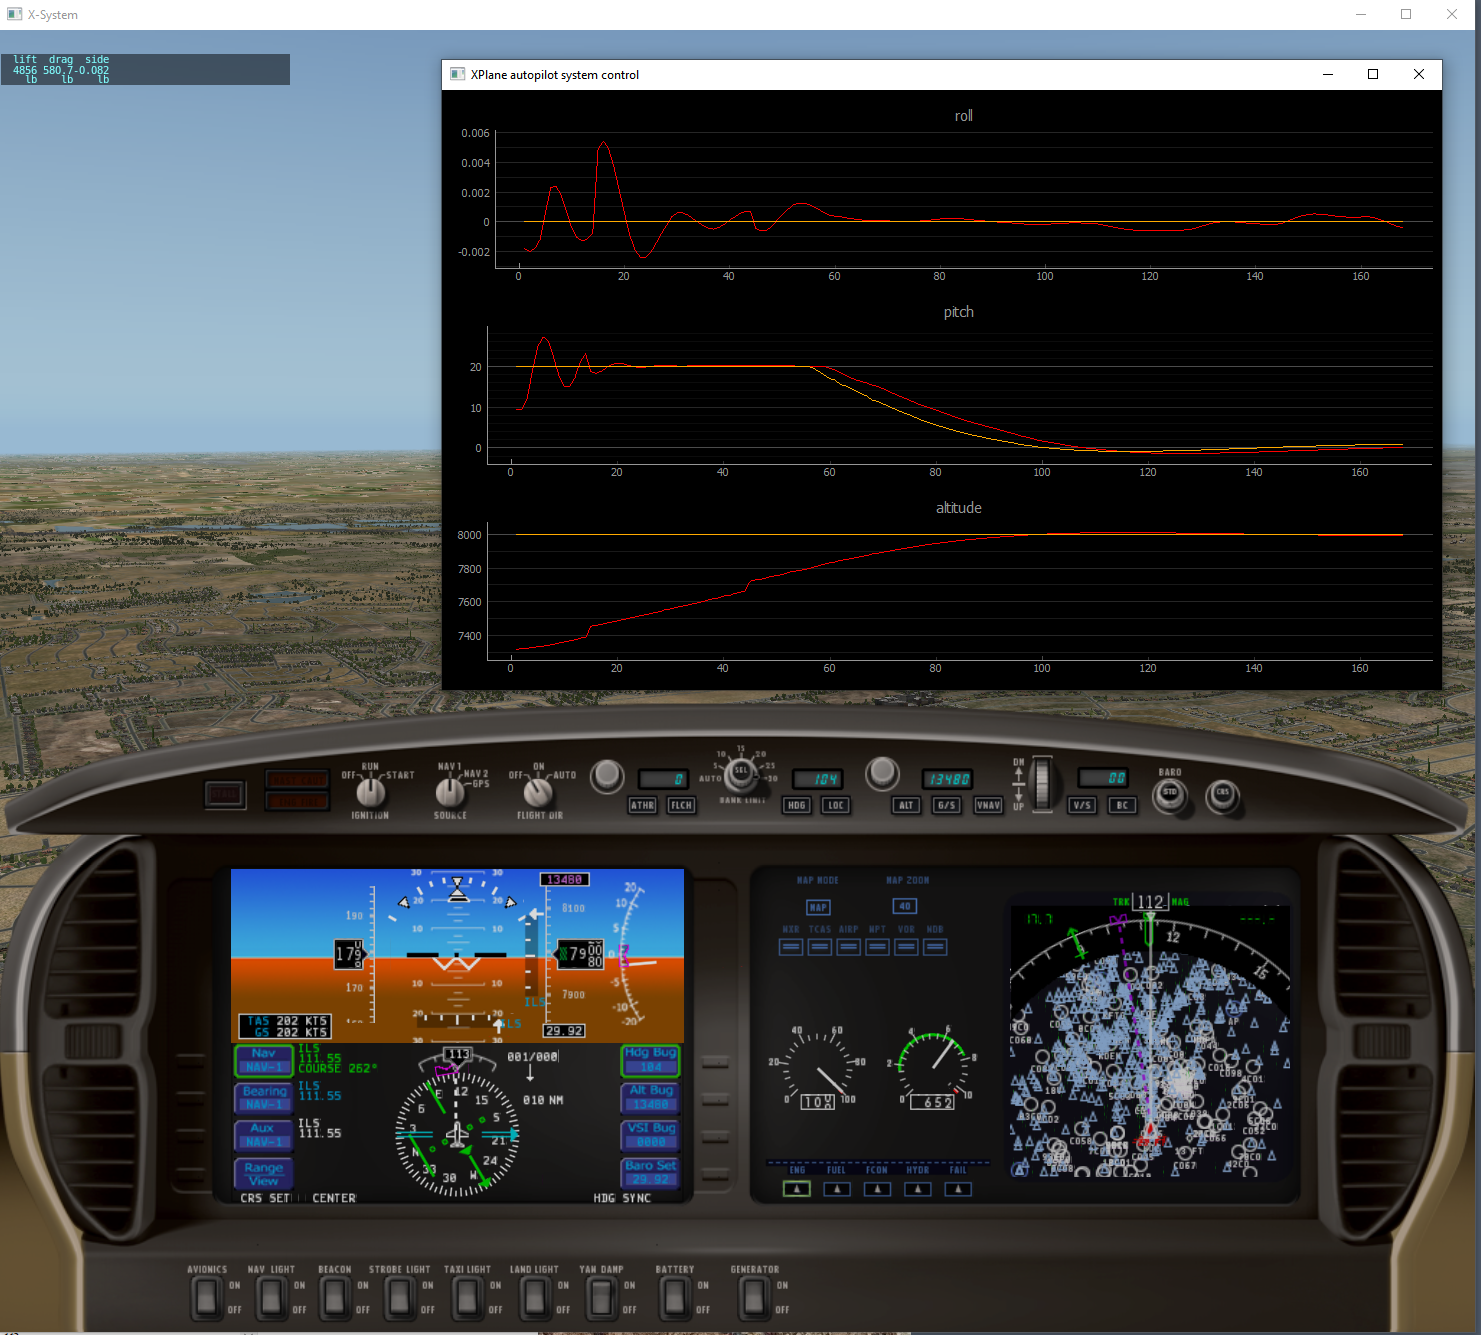
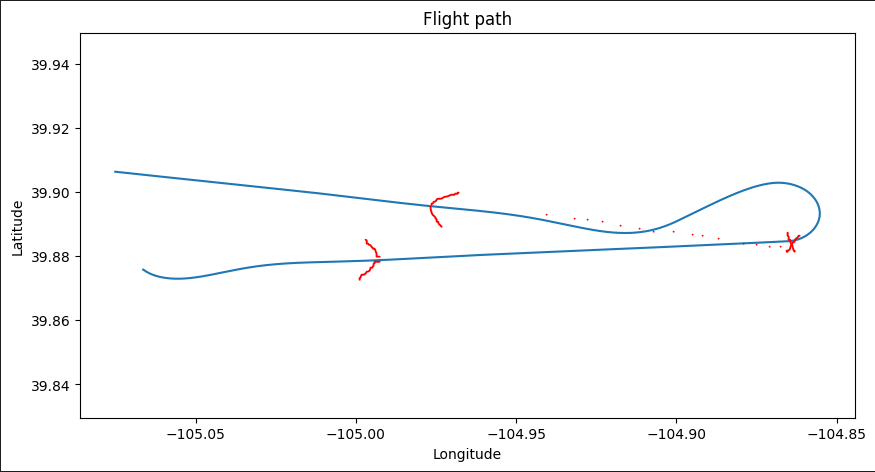
The cross track error settles down to < 10 m after a minute or so. It is a little “lazy”. If it is on a track that is due east, and I flip the track to due west, it’ll dutifully do the 180, then attempt to rejoin the track but it overshoots a bit and settles down after ~1 oscillation. I could probably turn up the P on the xte PID and that would help. Below is a track of tacking off from KBJC and the doing direct to DVV. The X is where I clicked Direct to back to the BJC VOR, it turned left and rejoined the track, overshooting, then settling back in nicely.
The Python Autopilot Code
I’m not going to pretend I wrote the cross track distance code, nor will I pretend to understand it. It works. The sign of the result depends on something along the lines of which side of the great circle line you are on. Luckily, aircraft (and boats and other things that follow tracks) don’t typically go from B to A. They go from A to B so this is consistent no matter which direction the track is facing. If they do need to go back to the start, the start becomes the end, if that makes sense.
This is the glorious cross track distance code along with some test code. Using Google Earth, the distance from the KBJC control tower to the centerline of 30R/12L should be ~0.44 km.
def cross_track_distance(point, start, end):
    # Convert all latitudes and longitudes from degrees to radians
    point_lat, point_lon = math.radians(point[0]), math.radians(point[1])
    start_lat, start_lon = math.radians(start[0]), math.radians(start[1])
    end_lat, end_lon = math.radians(end[0]), math.radians(end[1])

    # Calculate the angular distance from start to point
    # Ensure the argument is within the domain of acos
    acos_argument = math.sin(start_lat) * math.sin(point_lat) + math.cos(start_lat) * math.cos(point_lat) * math.cos(point_lon - start_lon)
    acos_argument = max(-1, min(1, acos_argument))  # Clamp the argument between -1 and 1
    delta_sigma = math.acos(acos_argument)

    # Calculate the bearing from start to point and start to end
    theta_point = math.atan2(math.sin(point_lon - start_lon) * math.cos(point_lat),
                             math.cos(start_lat) * math.sin(point_lat) - math.sin(start_lat) * math.cos(point_lat) * math.cos(point_lon - start_lon))
    theta_end = math.atan2(math.sin(end_lon - start_lon) * math.cos(end_lat),
                           math.cos(start_lat) * math.sin(end_lat) - math.sin(start_lat) * math.cos(end_lat) * math.cos(end_lon - start_lon))

    # Calculate the cross track distance
    cross_track_dist = math.asin(math.sin(delta_sigma) * math.sin(theta_point - theta_end))

    # Convert cross track distance to kilometers by multiplying by the Earth's radius (6371 km)
    cross_track_dist = cross_track_dist * 6371

    return cross_track_dist

kbjc_runways = {
	"30R/12L": {
		"Runway 12L": {
			"Latitude": 39.91529286666667,
			"Longitude": -105.12841313333334
		},
		"Runway 30R": {
			"Latitude": 39.901373883333335,
			"Longitude": -105.10191808333333
		}
	}
}


kbjc_runway_30R_start = (kbjc_runways["30R/12L"]["Runway 30R"]["Latitude"], kbjc_runways["30R/12L"]["Runway 30R"]["Longitude"])
kbjc_runway_30R_end = (kbjc_runways["30R/12L"]["Runway 12L"]["Latitude"], kbjc_runways["30R/12L"]["Runway 12L"]["Longitude"])
kbjc_tower = (test_locations["kbjc_tower"]["lat"], test_locations["kbjc_tower"]["lon"])
def test_cross_track_distance():
	print(f"start lat: {kbjc_runway_30R_start[0]}, start lon: {kbjc_runway_30R_start[1]}")
	print(f"end lat: {kbjc_runway_30R_end[0]}, end lon: {kbjc_runway_30R_end[1]}")
	print(f"tower lat: {kbjc_tower[0]}, tower lon: {kbjc_tower[1]}")

	dist = cross_track_distance(kbjc_tower, kbjc_runway_30R_start, kbjc_runway_30R_end)
	print(f"cross track distance: {dist}")

test_cross_track_distance()
And the rest of the magic happens in this block. If you recall from the last post (Adding some polish to the X-Plane Python Autopilot with Flask, Redis, and WebSockets), I am using Redis as a store to hold the setpoints from the web app controlling the autopilot. It is fast enough that I don’t need to worry about latency when running at 10 Hz (the loop durations are consistently less than 30 milliseconds, with the bulk of that time being used to get and set data from X-Plane itself).
# get the setpoints from redis
setpoints = get_setpoints_from_redis()
# check if we have just changed to direct-to mode and if so, update the direct to coords. same if the target waypoint has changed
if (setpoints["hdg_mode"] == "d_to" and previous_nav_mode != "d_to") or (setpoints["target_wpt"] != previous_nav_target):
print("reason for entering this block")
print(f"previous nav mode: {previous_nav_mode}, setpoints hdg mode: {setpoints['hdg_mode']}, previous nav target: {previous_nav_target}, setpoints target wpt: {setpoints['target_wpt']}")
# d_to_start_coords is the current position, in lat,lon tuple
d_to_start_coords = (posi[0], posi[1])
# this function does a lookup in the nav_points dataframe to get the lat, lon of the target waypoint
# it could certainly be optimized to use something faster than a pandas dataframe
d_to_target_coords = get_nav_point_lat_lon(setpoints["target_wpt"])
# reset xte PID
xte_PID.clear()
print(f"setting d_to_start_coords to {d_to_start_coords}")
# these are unchanged
desired_alt = setpoints["desired_alt"]
desired_speed = setpoints["desired_speed"]
if setpoints["hdg_mode"] == "hdg":
# if we're in heading mode, just use the desired heading. this is mostly unchanged from the previous iteration
desired_hdg = setpoints["desired_hdg"]
heading_error = get_angle_difference(desired_hdg, current_hdg)
heading_error_PID.update(heading_error)
elif setpoints["hdg_mode"] == "d_to":
# if we're in direct-to mode, calculate the cross-track error and update the xte_PID.
# I am using xte to mean cross-track error/distance
xte = cross_track_distance((posi[0], posi[1]), d_to_start_coords, d_to_target_coords)
xte_PID.update(xte)
# calculate the heading correction based on the xte_PID output
heading_correction = xte_PID.output
# this is essentially saying for 1 km of cross-track error, we want to correct by 30 degrees
heading_correction = heading_correction * 30
# limit the heading correction to -45 to 45 degrees
heading_correction = normalize(heading_correction, -45, 45)
# calculate the track heading to the target waypoint. the track heading is the heading we would
# need to fly to get to the target waypoint from the current position. it is used as an initial heading
track_heading = get_bearing((posi[0], posi[1]), d_to_target_coords)
# adjust the desired heading by the heading correction
adjusted_desired_hdg = track_heading + heading_correction
# make sure the adjusted desired heading is between 0 and 360
adjusted_desired_hdg = adjusted_desired_hdg % 360
# calculate the heading error based on the adjusted desired heading, this is no different than the hdg mode
adjusted_heading_error = get_angle_difference(adjusted_desired_hdg, current_hdg)
heading_error_PID.update(adjusted_heading_error)
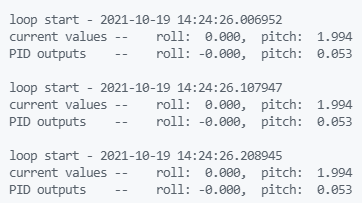
# log the current values
print(f"track hdg: {track_heading:.1f}, heading corr: {heading_correction:.1f}, adj desired hdg: {adjusted_desired_hdg:.1f}, adj heading err: {adjusted_heading_error:.1f}")
# write to a log file so we can make nice plots for the blog post
log_line = f"{datetime.now().strftime('%Y-%m-%d %H:%M:%S.%f')[:-3]},{posi[0]},{posi[1]},{posi[2]},{xte},{xte_PID.output},{track_heading},{heading_correction},{adjusted_desired_hdg},{adjusted_heading_error}"
with open(current_run_log_filename, "a") as log_file:
log_file.write(log_line + "\n")
Getting nav data from X-Plane data files
If you looked at the code closely, you will see the d_to_target_coords is set via a function called get_nav_point_lat_lon(nav_point). This looks up lat/lon in a file that was generated by parsing the X-Plane navigation data. In my previous job, I dealt with fixed width data formats. It is not fun. I originally tried to split based on spaces, but some of the nav point names have more than one space in them. I suppose I could just ignore the name but this is already written. This code parses the earth_nav.dat file, specifically for type 3, which is VOR/DME-like.
import pandas as pd

nav_filepath = r"C:\Users\Austin\Desktop\X-Plane 10\Resources\default data\earth_nav.dat"

raw_file_data = open(nav_filepath, 'r').readlines()

# remove first 3 lines
raw_file_data = raw_file_data[3:]

# remove last line
raw_file_data = raw_file_data[:-1]

# remove new line characters
raw_file_data = [line.replace('\n', '') for line in raw_file_data]

# Adjusting the function based on the new column map provided
def parse_nav_info(line):
    column_map = {
        'type': {'start': 0, 'end': 1},
        'lat_sign': {'start': 2, 'end': 3},
        'latitude': {'start': 3, 'end': 15},
        'lon_sign': {'start': 15, 'end': 16},
        'longitude': {'start': 16, 'end': 28},
        'elevation': {'start': 29, 'end': 35},
        'frequency': {'start': 36, 'end': 41},
        'range': {'start': 42, 'end': 45},
        'unknown': {'start': 46, 'end': 52},
        'identifier': {'start': 53, 'end': 56},
        'name': {'start': 56}  # Assuming end is not needed; take till the end of the line
    }

    nav_info = {}
    for column, column_info in column_map.items():
        start = column_info['start']
        end = column_info.get('end', None)
        value = line[start:end].strip()
        # print(f"attempting to parse {column} with value {value}")
        if column == 'latitude':
            lat_sign = line[column_map['lat_sign']['start']:column_map['lat_sign']['end']]
            lat_sign = -1 if lat_sign == '-' else 1
            value = lat_sign * float(value)
        elif column == 'longitude':
            lon_sign = line[column_map['lon_sign']['start']:column_map['lon_sign']['end']]
            lon_sign = -1 if lon_sign == '-' else 1
            value = lon_sign * float(value)
        elif column == 'elevation':
            value = int(value)
        elif column == 'frequency':
            value = int(value)
        elif column == 'range':
            value = int(value)
        nav_info[column] = value

    return nav_info

i = 0
data = []
types = []
for line in raw_file_data:
    line_type = int(line[0:2])
    if line_type != 3:
        continue

    line_data = parse_nav_info(line)
    data.append(line_data)

df = pd.DataFrame(data)
columns_of_interest = ['identifier','latitude','longitude','elevation', 'frequency', 'range', 'name']
df = df[columns_of_interest]
df.head()

df.to_pickle('nav_data.pkl')
The code to read the file and import is at the beginning of the python_autopilot.py file and is fairly straightforward:
# nav_data.pkl is a pandas dataframe. yes, this should use a dict or something faster.
nav_points = pickle.load(open("nav_data.pkl", "rb"))

def get_nav_point_lat_lon(id):
	nav_point = nav_points[nav_points["identifier"] == id]
	return nav_point["latitude"].values[0], nav_point["longitude"].values[0]
And for the Flask side of the house, we have index.html:
<!DOCTYPE html>
<html>
<head>
    <title>Autopilot Interface</title>
    <script src="https://cdnjs.cloudflare.com/ajax/libs/socket.io/4.0.1/socket.io.js"></script>
<script type="text/javascript" charset="utf-8">
    var socket;  // Declare socket globally

    // Define adjustSetpoint globally
    function adjustSetpoint(label, adjustment) {
        socket.emit('adjust_setpoint', {label: label, adjustment: adjustment});
    }

    function submitDirectTo() {
        const stationId = document.getElementById('target_wpt_input').value; // Grab the value from the input
        if (stationId) { // Check if the stationId is not empty
            adjustSetpoint('target_wpt', stationId); // Adjust the setpoint with the stationId as the value
            adjustSetpoint('hdg_mode', "d_to"); // Your existing function call
        } else {
            alert("Please enter a station ID.");
        }
    }

    document.addEventListener('DOMContentLoaded', () => {
        socket = io.connect(location.protocol + '//' + document.domain + ':' + location.port);

        socket.on('connect', () => {
            console.log("Connected to WebSocket server.");
        });

        // Listen for update_setpoints event to initialize the UI with Redis values
        socket.on('update_setpoints', function(setpoints) {
          for (const [label, value] of Object.entries(setpoints)) {
              const element = document.getElementById(label);
              if (element) {
                  element.innerHTML = value;
              }
          }
      });

        // Listen for update_setpoint events from the server
        socket.on('update_setpoint', data => {
            // Assuming 'data' is an object like {label: new_value}
            for (const [label, value] of Object.entries(data)) {
                // Update the displayed value on the webpage
                const element = document.getElementById(label);
                if (element) {
                    element.innerHTML = value;
                }
            }
        });
    });
</script>
<style>
    body {
        font-family: Arial, sans-serif;
        margin: 20px;
        background-color: #f4f4f4;
        color: #333;
    }
    h1 {
        color: #005288;
    }
    ul {
        list-style-type: none;
        padding: 0;
    }
    ul li {
        margin: 10px 0;
    }
    button, input[type="text"] {
        padding: 10px;
        margin-top: 5px;
        border: 1px solid #ccc;
        border-radius: 5px;
        cursor: pointer;
        font-size: 16px;
    }
    button:hover {
        background-color: #ddd;
    }
    .button-group {
        margin-bottom: 20px;
    }
    #target_wpt_input {
        margin-right: 10px;
    }
</style>

</head>
<body>
    <h1>Autopilot Interface</h1>
    <p>Current Setpoints:</p>
    <ul>
        <li>Heading: <span id="desired_hdg">0</span></li>
        <li>Altitude: <span id="desired_alt">0</span></li>
        <li>Speed: <span id="desired_speed">0</span></li>
        <li>Heading Mode: <span id="hdg_mode">0</span></li>
        <li>Target Waypoint: <span id="target_wpt">BJC</span></li>
    </ul>
    <p>Autopilot: <span id="autopilot_enabled">OFF</span></p>

    <!-- Example buttons for adjusting setpoints -->
    <div class="button-group">
        <button onclick="adjustSetpoint('desired_hdg', -10)">-10 HDG</button>
        <button onclick="adjustSetpoint('desired_hdg', 10)">+10 HDG</button>
    </div>
    <div class="button-group">
        <button onclick="adjustSetpoint('desired_alt', 500)">+500 ALT</button>
        <button onclick="adjustSetpoint('desired_alt', -500)">-500 ALT</button>
    </div>
    <div class="button-group">
        <button onclick="adjustSetpoint('desired_speed', 5)">+5 KTS</button>
        <button onclick="adjustSetpoint('desired_speed', -5)">-5 KTS</button>
    </div>
    <div class="button-group">
        <button onclick="adjustSetpoint('hdg_mode', 'hdg')">Follow Heading</button>
        <input type="text" id="target_wpt_input" value="BJC">
        <button onclick="submitDirectTo()">Direct To</button>
    </div>
    <div class="button-group">
        <button onclick="adjustSetpoint('autopilot_enabled', 1)">Enable Autopilot</button>
        <button onclick="adjustSetpoint('autopilot_enabled', 0)">Disable Autopilot</button>
    </div>

</body>
</html>
And the Flask app itself. I still think WebSockets are magic.
from flask import Flask, render_template
from flask_socketio import SocketIO, emit
import redis

app = Flask(__name__)
socketio = SocketIO(app)
r = redis.StrictRedis(host='localhost', port=6379, db=0)

setpoints_of_interest = ['desired_hdg', 'desired_alt', 'desired_speed']
# get initial setpoints from Redis, send to clients

@app.route('/')
def index():
    return render_template('index.html')  # You'll need to create an HTML template

def update_setpoint(label, adjustment):
    # This function can be adapted to update setpoints and then emit updates via WebSocket
    current_raw_value = r.get(label) if r.exists(label) else None
    if current_raw_value is not None:
        try:
            current_value = float(current_raw_value)
        except ValueError:
            current_value = current_raw_value

    if label == 'desired_hdg':
        new_value = (current_value + adjustment) % 360
    elif label == 'autopilot_enabled':
        new_value = adjustment
    elif label == 'hdg_mode':
        new_value = adjustment
    elif label == 'target_wpt':
        new_value = adjustment
    else:
        new_value = current_value + adjustment

    r.set(label, new_value)
    # socketio.emit('update_setpoint', {label: new_value})  # Emit update to clients
    return new_value

@socketio.on('adjust_setpoint')
def handle_adjust_setpoint(json):
    label = json['label']
    adjustment = json['adjustment']
    # Your logic to adjust the setpoint in Redis and calculate new_value
    new_value = update_setpoint(label, adjustment)

    # Emit updated setpoint to all clients
    emit('update_setpoint', {label: new_value}, broadcast=True)

@socketio.on('connect')
def handle_connect():
    # Fetch initial setpoints from Redis
    initial_setpoints = {label: float(r.get(label)) if r.exists(label) else 0.0 for label in setpoints_of_interest}

    # Emit the initial setpoints to the connected client
    emit('update_setpoints', initial_setpoints)

if __name__ == '__main__':
    socketio.run(app)
And here’s the full code of the autopilot itself. This will be transferred to GitHub for the next post. It is a bit long and needs to be split out into a number of separate files.
Conclusion
With a cross track distance known, it isn’t terribly difficult to convert that distance (error) into a heading adjustment. We now have a functioning autopilot that can control our aircraft to any VOR-like point. I could extend the X-Plane nav data parsing to read all points, but I’ll leave that as an exercise for the reader. The X-Plane Python Autopilot is almost complete – all that I have left on the checklist is a “takeoff” button. Hope you enjoyed the post!
References
This page was pretty helpful for realizing the code for determining the cross track distance would be complicated – http://www.movable-type.co.uk/scripts/latlong-vincenty.html. A good bit of the code was generated by ChatGPT as well.