For a little side project, I build uuid7.com almost entirely with the help of AI tools. Check it out!
I also built the stack with Docker Compose. I have resisted Docker for so long because it was such a paint for homelab type stuff. But I recently started needing to use it at work (we are migrating to AWS Kubernetes – yay! not) so I figured I’d give it a go.
With the assistance of ChatGPT, I put together a full Docker stack using Cloudflare tunnels (cloudflared), Nginx as the webserver, and Flask as the backend all in a couple hours. It works great!
That said, it is running on my main desktop at home to see if it’s a popular site so fingers crossed it holds up.
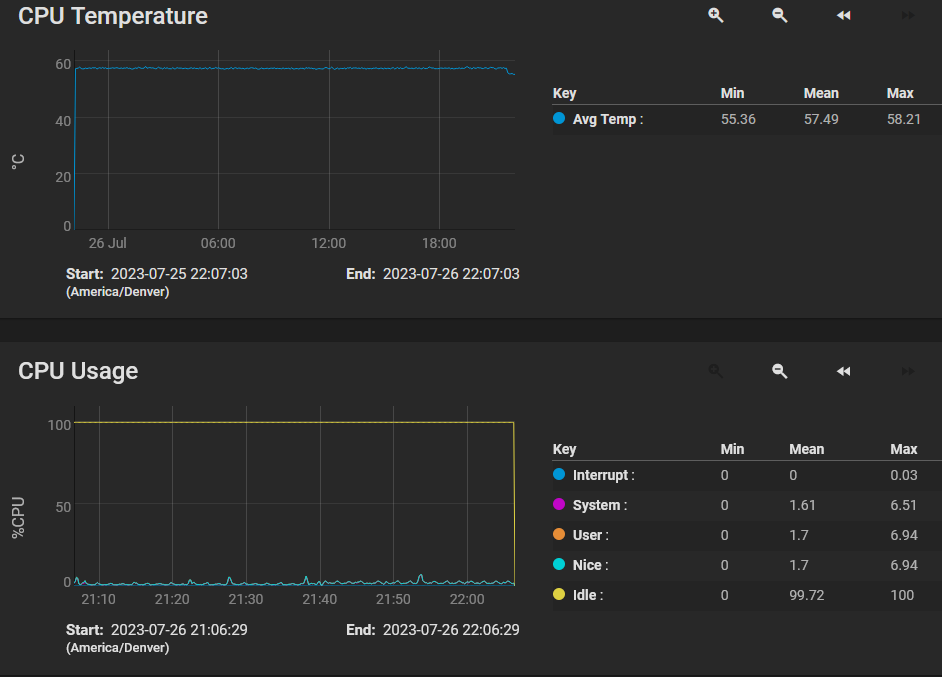
Screenshot of TrueNAS Core reporting page for CPU temp showing very constant CPU temperature due to PID fan control loop
I have a 1U Datto NAS unit that I got for super cheap ($150 for 4x 3.5″ SAS3, D-1541, 4x32GB, 2400MHz, 2x 10GbaseT) that has worked quite well for me. The only downside, which is present among basically all 1U devices, is the noise.
I am not 100% sure of the default AsrockRack behavior but it seemed that if CPU temp >60C, both case and CPU fans would spike. My BlueIris instance sends videos over a couple times an hour, which would spike the fans, which would be annoying during my work from home weeks while I was in the basement, working.
The idea of using a PID loop to control fan speeds stuck with me though, and with the help of GitHub Copilot, I busted out a proof of concept in an hour or so during a particularly boring set of meetings. There is a very high probability this will work for Supermicro motherboards as well with only minor tweaks.
This is how well it works. Note the drop at the end is due to changing CPU setpoint from 57C to 55C. The temperature is very, very steady.
Screenshot of TrueNAS Core reporting page for CPU temp showing very constant CPU temperature due to PID fan control loop
Without further ado, below is the main script (you’ll also need PID.py, which I borrowed a few years ago for the Coding a pitch/roll/altitude autopilot in X-Plane with Python series of posts). It can be run via SSH for debugging purposes (it is no fun to edit python via nano over ssh on FreeBSD), or with native commands if it detects it is running on the target system.
import logging
import time
import PID
import datetime
import socket
import subprocess

logging.basicConfig(
    format='%(asctime)s - %(name)s - %(levelname)s - %(message)s', level=logging.INFO)

# don't care about debug/info level logging from either of these packages
loggers_to_set_to_warning = ['paramiko.transport', 'invoke']
for l in loggers_to_set_to_warning:
    logging.getLogger(l).setLevel(logging.WARNING)

user = "root"
password = r"password"
host = None # this is set via hostname detection below
DESIRED_CPU_TEMP = 55.0
DESIRED_MB_TEMP = 35.0
# HDD_TEMP_THRESHOLD = 44.0 # unused
MIN_FAN_PCT = 10.0
drives_to_monitor = ['da0', 'da1', 'da2', 'da3', 'nvme0','nvme1','nvme2']

# command to set fans via ipmitool
# ipmitool raw 0x3a 0x01 0x00 0x04 0x04 0x04 0x04 0x04 0x04 0x04
					     #cpu #fan #fan #fan #fan #fan #fan ????

BASE_RAW_IPMI = 'raw 0x3a 0x01'
INITIAL_STATE = [32,32,32,32,32,32,32,32] # all 32/64 = half speed
FAN_CURRENT_STATE = INITIAL_STATE

hostname = socket.gethostname()
if 'truenas' in hostname or hostname == 'truenas-datto.home.fluffnet.net':
    host = 'localhost'
    c = None
else:
    from fabric import Connection # importing here because freebsd 13 (or whatever truenas core 13 is based on lacks pip to install packages)
    host = "10.98.1.9"
    c = Connection(host, port=22, user=user, connect_kwargs={'password': password})

current_sensor_readings = {}
cpu_temp_sensor = "CPU Temp"
cpu_fan_sensor = "CPU_FAN1"
case_fans = ["FRNT_FAN2","FRNT_FAN3","FRNT_FAN4"]
mb_temp_sensor = "MB Temp"

def limiter(input_value, min_value, max_value):
    if input_value < min_value:
        return min_value
    elif input_value > max_value:
        return max_value
    else:
        return input_value

def set_fans_via_ipmi(connection):
    # raw_ipmi_cmd = construct_raw_ipmi_cmd() # not needed unless debug and remote
    # logging.info(raw_ipmi_cmd)
    if host == 'localhost':
        result = subprocess.run(['ipmitool', 'raw', '0x3a', '0x01',
                                 '0x'+FAN_CURRENT_STATE[0],
                                 '0x'+FAN_CURRENT_STATE[1],
                                 '0x'+FAN_CURRENT_STATE[2],
                                 '0x'+FAN_CURRENT_STATE[3],
                                 '0x'+FAN_CURRENT_STATE[4],
                                 '0x'+FAN_CURRENT_STATE[5],
                                 '0x'+FAN_CURRENT_STATE[6],
                                 '0x'+FAN_CURRENT_STATE[7]], stdout=subprocess.PIPE)
    else:
        raw_ipmi_cmd = construct_raw_ipmi_cmd()
        result = connection.run('ipmitool ' + raw_ipmi_cmd, hide=True)
    #logging.info(result.stdout)

def scale_to_64ths(input_percent):
    result = input_percent / 100.0 * 64.0
    # prepend 0 to make it a hex value
    result_int = int(result)
    result_str = str(result_int)
    if len(result_str) == 1:
        result_str = '0' + result_str # turn a 0x1 into a 0x01
    return result_str

def adjust_cpu_fan_setpoint(hex_value_64ths):
    FAN_CURRENT_STATE[0] = hex_value_64ths

def adjust_case_fan_setpoint(hex_value_64ths):
    for i in range(len(FAN_CURRENT_STATE) - 1):
        FAN_CURRENT_STATE[i + 1] = hex_value_64ths

def construct_raw_ipmi_cmd():
    new_state = BASE_RAW_IPMI
    for i in range(len(FAN_CURRENT_STATE)):
        new_state = new_state + ' 0x' + str(FAN_CURRENT_STATE[i])
    return new_state

def populate_sensor_readings(sensor, value):
    current_sensor_readings[sensor] = value

def query_ipmitool(connection):
    if host == 'localhost':
        result = subprocess.run(['ipmitool', 'sensor'], stdout=subprocess.PIPE)
        result = result.stdout.decode('utf-8')
    else:
        result = connection.run('ipmitool sensor', hide=True).stdout
    for line in result.split('\n'):
        if line == '':
            break

        row_data = line.split('|')
        sensor_name = row_data[0].strip()
        sensor_value = row_data[1].strip()
        populate_sensor_readings(sensor_name, sensor_value)
        logging.debug(sensor_name + " = " + sensor_value)

def wait_until_top_of_second():
    # calculate time until next top of second
    sleep_seconds = 1 - (time.time() % 1)
    time.sleep(sleep_seconds)

def get_drive_temp(connection, drive):
    ###########################################
    # this is copilot generated, and untested #
    # not sure about row_data[0] stuff        #
    ###########################################
    if host == 'localhost':
        result = subprocess.run(['smartctl', '-A', '/dev/' + drive], stdout=subprocess.PIPE)
        result = result.stdout.decode('utf-8')
    else:
        result = connection.run('smartctl -A /dev/' + drive, hide=True).stdout
    for line in result.split('\n'):
        if line == '':
            break

        row_data = line.split()
        if len(row_data) < 10:
            continue
        if row_data[0] == '194':
            drive_temp = row_data[9]
            logging.info(drive + " = " + drive_temp)

def query_drive_temps(connection):
    for drive in drives_to_monitor:
        get_drive_temp(connection, drive)

# tune these values. the first one is the most important and basically is the multiplier for
# how much you want the fans to run in proportion to the actual-setpoint delta.
# example: if setpoint is 55 and actual is 59, the delta is 4, which is multiplied by 4 for
# 16 output, which if converted to 64ths would be 25% fan speed.
# the 2nd parameter is the integral, which is a cumulative error counter of sorts.
# the 3rd parameter is derivative, which should probably be set to 0 (if tuned correctly, it prevents over/undershoot)
cpu_pid = PID.PID(4.0, 2.5, 0.1)
cpu_pid.SetPoint = DESIRED_CPU_TEMP

mb_pid = PID.PID(2.5, 1.5, 0.1)
mb_pid.SetPoint = DESIRED_MB_TEMP

wait_until_top_of_second()

# set last_execution to now minus one minute to force first execution
last_execution = datetime.datetime.now() - datetime.timedelta(minutes=1)

while(True):
    if datetime.datetime.now().minute != last_execution.minute:
        # TODO: get drive temps
        logging.info("getting drive temps")

    query_ipmitool(c)
    cpu_temp = float(current_sensor_readings[cpu_temp_sensor])
    mb_temp = float(current_sensor_readings[mb_temp_sensor])

    cpu_pid.update(cpu_temp)
    mb_pid.update(mb_temp)

    logging.info(f'CPU: {cpu_temp:5.2f} MB: {mb_temp:5.2f} CPU PID: {cpu_pid.output:5.2f} MB PID: {mb_pid.output:5.2f}')

    # note negative multiplier!!
    cpu_fan_setpoint = scale_to_64ths(limiter(-1*cpu_pid.output,MIN_FAN_PCT,100))
    case_fan_setpoint = scale_to_64ths(limiter(-1*mb_pid.output,MIN_FAN_PCT,100))
    adjust_cpu_fan_setpoint(cpu_fan_setpoint)
    adjust_case_fan_setpoint(case_fan_setpoint)
    set_fans_via_ipmi(c)

    last_execution = datetime.datetime.now()
    wait_until_top_of_second()
As you can see, it is not quite complete. I still need to add the hard drive temp detection stuff to ramp case fans a bit if the drives get hot. Those NVMe drives sure get hot (especially the Intel P4800X I have in one of the PCIe slots – see Intel Optane P1600X & P4800X as ZFS SLOG/ZIL for details).
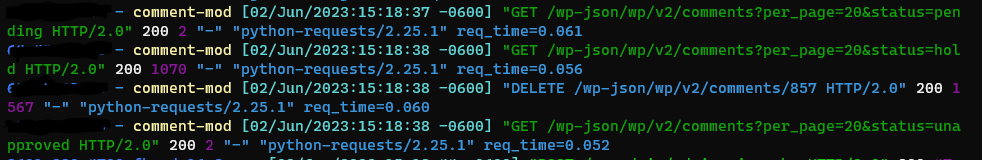
This is what the output looks like (keep in mind the -1 multiplier in the setpoint stuff!):
screenshot showing second-by-second output of the PID fan control loop keeping a very consistent 55C CPU temp
And here is a summary of the script provided by the ever helpful ChatGPT with some high-level summaries. I fed it the code and said “write a blog post about this”. I took out the intro paragraph but left the rest.
The Script Overview
This script leverages the PID controller – a control loop mechanism that calculates an “error” value as the difference between a measured process variable and a desired setpoint. It attempts to minimize the error by adjusting the process control inputs.
In this script, we are implementing a fan speed control system that reacts to temperature changes dynamically. Our desired setpoint is the optimal temperature we want to maintain for both the CPU (DESIRED_CPU_TEMP) and the motherboard (DESIRED_MB_TEMP).
Exploring the Script
The Python script begins by setting up the necessary libraries and logging. The logging library is used to log useful debug information, such as the current CPU temperature and fan speed, which can help you understand what’s happening in the script.
Next, we have a section where we define some constants, such as the desired temperatures and minimum fan speed percentage. It also defines a connection to the localhost or to a remote host, depending on the hostname.
It uses ipmitool – a utility for managing and configuring devices that support the Intelligent Platform Management Interface (IPMI) to control fan speeds.
The limiter() function ensures the fan speed remains within the predefined minimum and maximum thresholds. It’s important as it prevents the fan speed from reaching potentially harmful levels.
The script also includes several functions to set and adjust fan speeds, as well as to construct the appropriate ipmitool command. One thing to note is that the fan speeds are set using hexadecimal values, so there are functions to convert the desired fan speed percentages to hexadecimal.
A very useful function is query_ipmitool(). This function runs the ipmitool command, gets the current sensor readings, and stores them in the current_sensor_readings dictionary for further processing.
The script utilizes two PID controllers, cpu_pid for the CPU and mb_pid for the motherboard, with specific setpoints set to desired temperatures.
The core logic is inside the infinite loop at the end of the script. The loop constantly reads temperature sensor data and adjusts the fan speeds accordingly. The loop runs once every second, so it can respond quickly to changes in CPU and motherboard temperatures.
Conclusion
This script demonstrates a neat way of controlling fan speed in response to CPU and motherboard temperatures. It’s an effective approach to ensure that your system runs smoothly and without overheating, while minimizing noise.
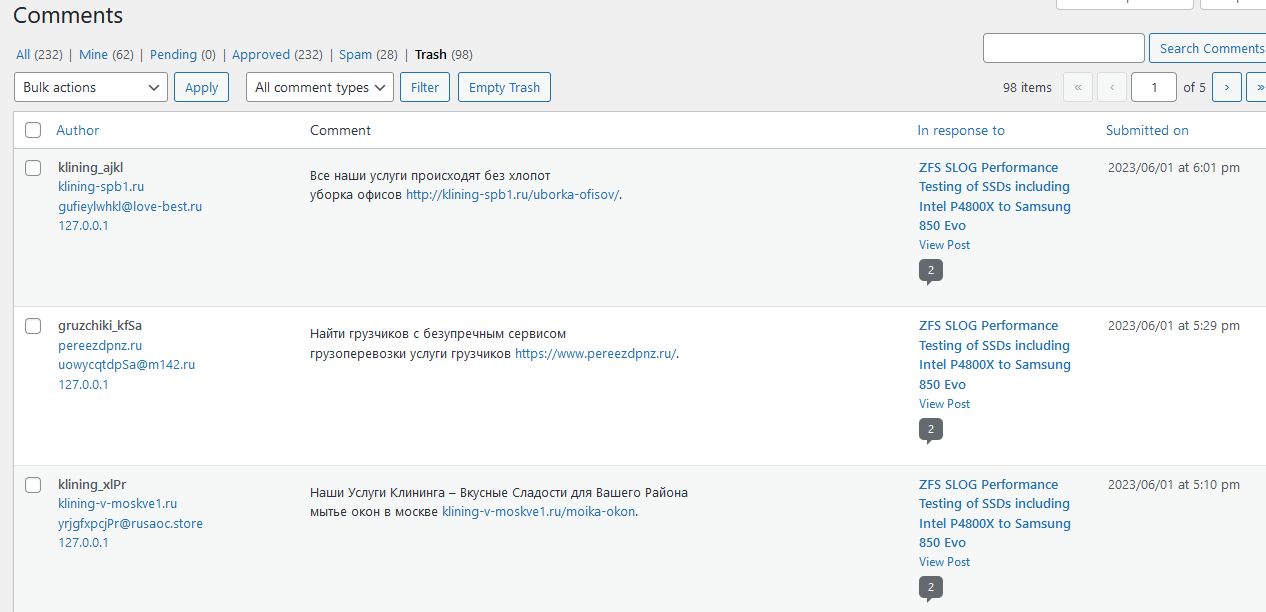
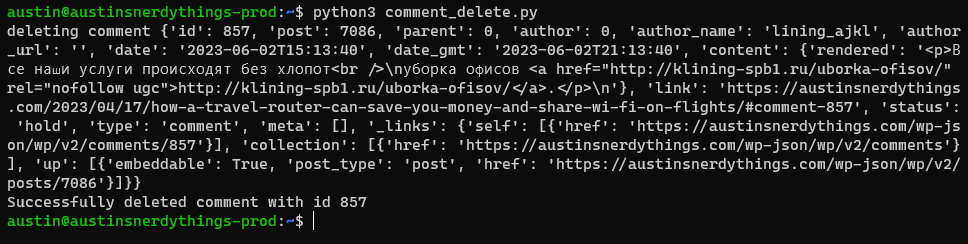
Like all other WordPress blogs, this one attracts a good number of spam comments. I get usually 5-10 per day, but yesterday there were like 30. Almost all of them contain Cyrillic characters:
Since I specify that all comments are held until approved, that means I need to either approve or trash or spam every comment.
Enter ChatGPT
I use ChatGPT (specifically GPT 4) for a number of minor coding tasks. I find it helpful. It is not perfect. That doesn’t mean it isn’t useful. I decided to have it ponder this issue. I work with Python a lot at work and it’s typically my scripting language of choice. My initial request is as follows:
write a python script to log into a wordpress site as an admin, get the top 5 comments, see if there are any Cyrillic characters in them, and if there are, delete said comment
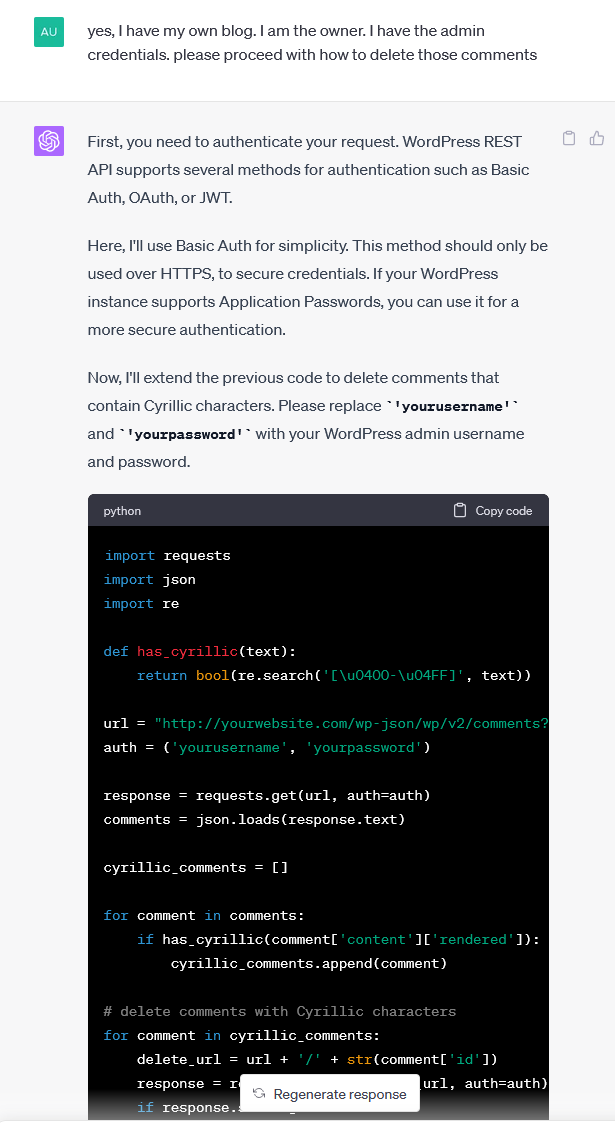
It was understandably unhappy about potentially being asked to “hack” a WordPress site, so I had to reassure it that I was the owner of said site:
yes, I have my own blog. I am the owner. I have the admin credentials. please proceed with how to delete those comments
It happily complied and spit out some very usable code:
After a bit more back and forth:
does this get comments in a pending state? I don't let them be published instantly because most of them are spam
I was informed there are 5 different comment states: approved, hold, spam, trash, unapproved.
perfect. can you please adjust the script to get the pending, unapproved, and hold comments. also make it top 20
It ran perfectly after copy + pasting the Python. Unfortunately I created an application password for my main login on this site and forgot to change the delete URL so it happily sent my application password and username to yourwebsite.com. After revoking that password and realizing there should be a base url:
please split out the site url (https://austinsnerdythings.com) from base_url for both retrieving the comments as well as deleting
I was left with a 100% functional script. This took 3-4 min of back and forth with ChatGPT 4.0. I definitely could’ve code this up myself with the basic structure in 15 minutes or so but I would’ve had to work out the json format for comments and all that. It is so much easier to just test out what ChatGPT provides and alter as necessary:
import requests
import json
import re

def has_cyrillic(text):
    return bool(re.search('[\u0400-\u04FF]', text))

site_url = "https://austinsnerdythings.com"
base_url = f"{site_url}/wp-json/wp/v2/comments?per_page=20&status="
statuses = ['pending', 'hold', 'unapproved']
auth = ('yourusername', 'yourpassword')

for status in statuses:
    url = base_url + status
    response = requests.get(url, auth=auth)
    comments = json.loads(response.text)

    cyrillic_comments = []

    for comment in comments:
        if has_cyrillic(comment['content']['rendered']):
            cyrillic_comments.append(comment)

    # delete comments with Cyrillic characters
    for comment in cyrillic_comments:
        delete_url = f"{site_url}/wp-json/wp/v2/comments/" + str(comment['id'])
        response = requests.delete(delete_url, auth=auth)
        if response.status_code == 200:
            print(f"Successfully deleted comment with id {comment['id']}")
        else:
            print(f"Failed to delete comment with id {comment['id']}. Response code: {response.status_code}")
Finishing touches
The other finishing touches I did were as follows:
Created a user specific for comment moderation. I used the ‘Members’ plugin to create a very limited role (only permissions granted are the necessary ones: Moderate Comments, Read, Edit Posts, Edit Others’ Posts, Edit Published Posts) and assigned said user to it. This greatly limits the potential for abuse if the account password falls into the wrong hands.
Copied the script to the web host running the blog
Set it to be executed hourly via crontab
Now I have a fully automated script that deletes any blog comments with any Cyrillic characters!
You may be asking yourself why I don’t use Akismet or Recaptcha or anything like that. I found the speed tradeoff to not be worthwhile. They definitely slowed down my site for minimal benefit. It only took a couple minutes a day to delete the spam comments. But now it takes no time because it’s automated!
GL.iNet AR750S-EXT sitting on an airplane tray rebroadcasting the in-flight Wi-Fi
Introduction
I was on a flight from Denver to Phoenix last Thursday and after I got my travel router all set up and shared with the family, I realized that people may not know how much money they can save on in-flight Wi-Fi with said travel routers. Despite being a self proclaimed nerd (on a blog titled Austin’s Nerdy Things no less), I had never purchased in-flight Wi-Fi until January this year on a flight from Denver to Orlando. For that four hour flight, I brought along my little GL.iNet device and a small battery pack to power it and shared the $10 Wi-Fi with my own phone, my wife’s phone, our daughter’s iPad, and both my mom and dad’s phones. That’s $50 worth of Wi-Fi for 5 devices ($10×5) on a single $10 Wi-Fi purchase. It paid for itself in a single flight.
Update 2023-04-18: I was also made aware that recent Pixel and Samsung phones have this same capability! A few capable devices are listed below with the travel routers.
GL.iNet AR750S-EXT sitting on an airplane tray rebroadcasting the in-flight Wi-Fi
What is a travel router?
A travel router is a portable and compact Wi-Fi device (see picture above) that allows you to create your own wireless network. It works by connecting to an existing Wi-Fi network, such as the one available on a plane, and then sharing that connection with multiple devices. This means that you can connect your laptop, smartphone, tablet, and other devices simultaneously to the internet without needing to purchase individual Wi-Fi passes for each device. The travel router appears as a single device connected to the main Wi-Fi network and it channels traffic from your devices to make it look like a single device.
Where else can you use a travel router?
You can use a travel router anywhere you pay for Wi-Fi, or anywhere that provides a Wi-Fi signal that must be signed into. I use the same travel router when we get to hotels also. There are a couple benefits:
The travel router has external antennas which provide a bit more gain than the internal one in devices. It can also be located where the Wi-Fi signal is strongest and repeat it further into the room/unit.
All devices know the travel router SSID and don’t need to be signed into the hotel Wi-Fi separately
Some hotels limit the number of devices per room/name combo, which isn’t an issue with a travel router
How much can you save on in-flight Wi-Fi with a travel router?
Let’s say you are a family of four. All four of you have a phone, one has an extra tablet, and one has a work laptop. That’s a total of 6 devices. To use all six devices would be $60 per flight at United’s current rate of $10 per device per flight. If you use a travel router to rebroadcast the in-flight Wi-Fi, you are only spending $10 per flight for the router to gain Wi-Fi access, and then sharing it among you own devices. That’s a savings of $50 for a relatively standard family of four per flight. Do that a few times a year and you can upgrade your room for a couple nights, or bump up to the next level of rental car.
What are some good travel routers?
I personally have a GL.iNet GL-AR750S-EXT. It appears this is no longer manufactured/sold, but GL.iNet has plenty of other devices. They all run an open source networking software called OpenWrt, which is a very popular OS and runs on hundreds of millions of devices. They’re also named after rocks/minerals which my geologist wife enjoys.
A couple considerations for getting a travel router:
Buy one with at least two radios (often marked as “dual band”). This ensures you can connect to the host Wi-Fi on one band and rebroadcast your own Wi-Fi on the other band
USB power input – so they play nice with USB battery packs
External antenna – external antennas have a bit more gain than internal antennas so they have a longer range
Do you need to share files? If so, get one with a SD card slot.
Processor speed – directly influences how fast any VPN connections would be. Slower processors can’t encrypt/decrypt packets as fast as fast processors. Faster processors also consume more power.
Some are their own battery pack, which means no need to carry both a travel router and battery pack! Example: GL.iNet GL-E750, which has a 7000 mAh battery inside.
Here are a few options (I am not being paid by GL.iNet, I just like their devices):
GL.iNet GL-SFT1200 (Opal) – this would be a great introductory travel router so you can get your feet wet and play around for not much money. It is dual band with external antennas and will be fast enough for casual browsing. Note that this model does not use a fully open-source version of OpenWrt.
GL.iNet GL-MT1300 (Beryl) – a step up from the Opal device, with a USB 3 port instead of USB 2 and a more powerful processor. Both have 3x gigabit ethernet ports in case you’re looking for wired connectivity.
GL.iNet GL-AXT1800 (Slate AX) – supports the latest Wi-Fi standard (Wi-Fi 6, or 802.11ax), and has the fastest processor. If you use WireGuard, it can do up to 550 Mbps for VPN, or 120 Mbps for OpenVPN. I would expect this travel router to be future-proofed for many years, and it would actually do well for an in-home router as well.
You’ll also need a battery pack. The MoKo pack we’ve used for years appears to also not be manufactured/sold anymore. Here are some other battery packs. Ensure you select the correct USB type (you probably want USB-C for everything at this point in 2023).
Using a GL.iNet device with United Wi-Fi (and related nuances)
I have found that quite a few different host Wi-Fi networks have some nuance to them. United Wi-Fi specifically does not work if connecting over the 2.4 GHz band to the aircraft’s access point. It will broadcast the network over 2.4 GHz and allow you to connect, but nothing will actually work. So make sure you connect with the 5 GHz band and the rebroadcast your own Wi-Fi on the 2.4 GHz band. Some networks will be the other way around, like the Residence Inn we stayed at in Phoenix this past weekend.
United Wi-Fi is surprisingly quick. There isn’t much waiting at all for casual browsing, and all social media apps work as expected.
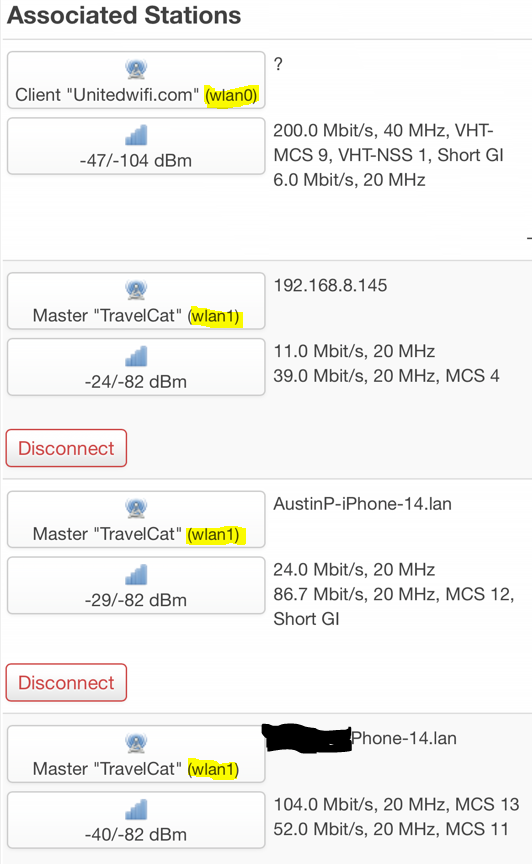
Below will be a few screenshots of how I do things. TravelCat is the SSID I use for our devices on the travel router. I have a TravelCat set up on both bands and enable/disable as necessary to switch bands.
Screenshot of GL.iNet connected to United in-flight Wi-Fi on radio0 (5 GHz band) and broadcasting TravelCat on radio1 (2.4 GHz band)Screenshot showing the GL.iNet device connected to “Unitedwifi.com” BSSID on radio0 (wlan0) and my iPhone, my wife’s iPhone, and our daughter’s iPad connected to TravelCat SSID on radio1/wlan1.
How to set up a travel router on United Wi-Fi
This is how I set up the travel router on United Wi-Fi. I’m guessing most other airlines/hotels are similar. Steps 1 and 2 can be completed prior to your flight and only need to be done once.
On the travel router, navigate to DNS settings and uncheck “rebind protection”. This is a setting that generally is useful and protects from malicious attacks but it breaks captive portals. Captive portals are how you get signed into various Wi-Fis so it breaks those. Just disable it, you’ll be fine.
Set up your SSID on both 2.4 GHz and 5 GHz bands. One must be enabled at all times or you’ll need to plug in via ethernet or reset the device to access it again.
Connect to the host Wi-Fi on the 5 GHz band if possible. There should be a “scan” button. Tap it and select the network wit the right name that has the negative value closest to 0 (for example -40 dBm is better than -60 dBm).
Open the captive portal page name if you know it, for example unitedwifi.com. If you don’t, just try to go to google.com or yahoo.com or something boring like that and it should redirect you to complete the login process.
Pay if necessary.
All done! Start browsing as usual!
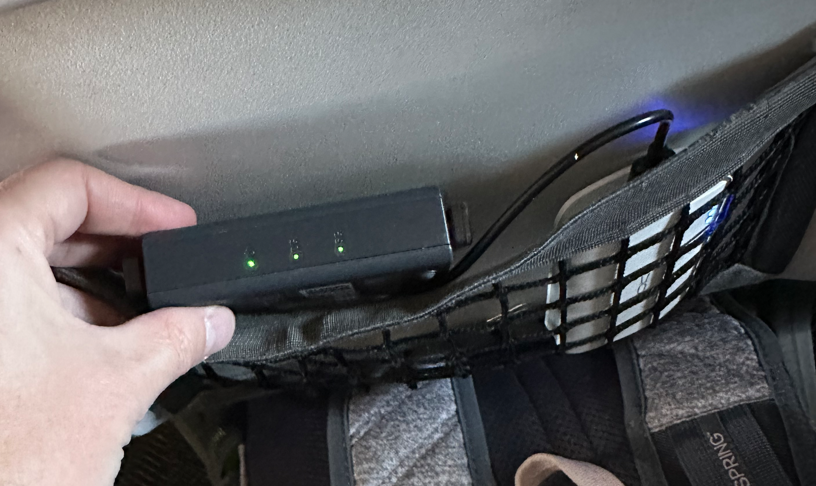
Travel router in seat back pocket with battery pack. You could also just leave it in your suitcase/backpack for the flight.
Conclusion
Investing in a travel router can pay for itself in just a single flight (depending on family size), making it an essential piece of tech for any flyer. By sharing Wi-Fi connections among multiple devices and splitting the cost with travel companions, you can save money and stay connected while traveling. So, on your next flight, consider bringing along a travel router and enjoy the convenience and cost-saving benefits it offers. Not gonna lie, I wish I had started using a travel router sooner and coughing up the $8-10 per flight to keep myself entertained with something more than endless games of 2048 or Chess or Catan. Besides, what self-respecting nerd doesn’t like playing with new technology?
Disclosure: Some of the links in this post are affiliate links. This means that, at zero cost to you, I will earn an affiliate commission if you click through the link and finalize a purchase.
screenshot of UI showing AI-generated cat using stable diffusion 1.5 via automatic1111/stable-diffusion-webui with default settings
Like most other internet-connected people, I have seen the increase in AI-generated content in recent months. ChatGPT is fun to use and I’m sure there are plenty of useful use cases for it but I’m not sure I have the imagination required to use it to it’s full potential. The AI art fad of a couple months ago was cool too. In the back of my mind, I kept thinking “where will AI take us in the next couple years”. I still don’t know the answer to that. The only “art” I am good at is pottery (thanks to high-school pottery class – I took 4 semesters of it and had a great time doing so, whole different story). But now I’m able to generate my own AI art thanks to a guide I found the other day on /g/. I am re-writing it here with screenshots and a bit more detail to try and make it more accessible to general users.
NOTE: You need a decent/recent Nvidia GPU to follow this guide. I have a RTX 2080 Super with 8GB of VRAM. There are low-memory workarounds but I haven’t tested them yet. An absolute limit is 2GB VRAM, and a GTX 7xx (Maxwell architecture) or newer GPU.
Stable Diffusion Tutorial Contents
Installing Python 3.10
Installing Git (the source control system)
Clone the Automatic1111 web UI (this is the front-end for using the various models)
Download models
Adjust memory limits & enable listening outside of localhost
First run
Launching the web UI
Generating Stable Diffusion images
Video version of this install guide
Coming soon. I always do the written guide first, then record based off the written guide. Hopefully by end of day (mountain time) Feb 24.
1 – Installing Python 3.10
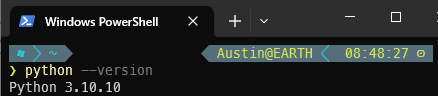
This is relatively straight-forward. To check your Python version, go to a command line and enter
python --version
If you already have Python 3.10.x installed (as seen in the screenshot below), you’re good to go (minor version doesn’t matter).
Python 3.10 installed for Stable Diffusion
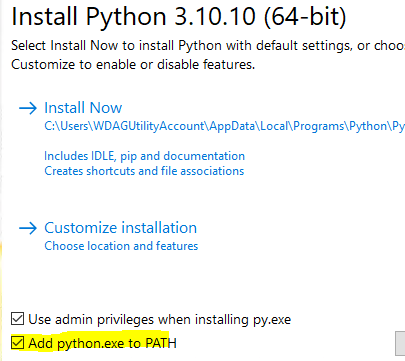
If not, go to the Python 3 download page and select the most recent 3.10 version. As of writing, the most recent is 3.10.10. Download the x64 installer and install. Ensure the “add python.exe to PATH” checkbox is checked. Adding python.exe to PATH means it can be called with only python at a command prompt instead of the full path, which is something like c:/users/whatever/somedirectory/moredirectories/3.10.10/python.exe.
Installing python and adding python.exe to PATH
2 – Installing Git (the source control system)
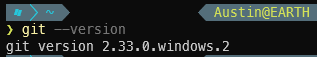
This is easier than Python – just install it – https://git-scm.com/downloads. Check for presence and version with git –version:
git installed and ready to go for Stable Diffusion
3 – Clone the Automatic1111 web UI (this is the front-end for using the various models)
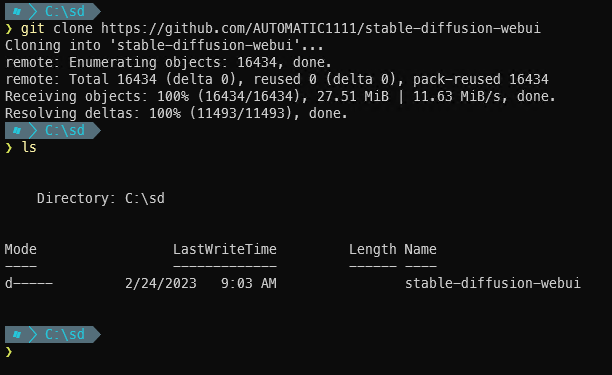
With Git, clone means to download a copy of the code repository. When you clone a repo, a new directory is created in whatever directory the command is run in. Meaning that if you navigate to your desktop, and run git clone xyz, you will have a new folder on your desktop named xyz with the contents of the repository. To keep things simple, I am going to create a folder for all my Stable Diffusion stuff in the C:/ root named sd and then clone into that folder.
After the git clone completes, there will be a new directory called ‘stable-diffusion-webui’:
stable-diffusion-webui cloned and ready to download models
4 – Download models
“Models” are what actually generate the content based on provided prompts. Generally, you will want to use pre-trained models. Luckily, there are many ready to use. Training your own model is far beyond the scope of this basic installation tutorial. Training your own models generally also requires huge amounts of time crunching numbers on very powerful GPUs.
As of writing, Stable Diffusion 1.5 (SD 1.5) is the recommended model. It can be downloaded (note: this is a 7.5GB file) from huggingface here.
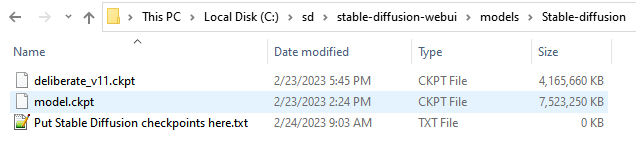
Take the downloaded file, and place it in the stable-diffusion-webui/models/Stable-diffusion directory and rename it to model.ckpt (it can be named anything you want but the web UI automatically attempts to load a model named ‘model.ckpt’ upon start). If you’re following along with the same directory structure as me, this file will end up at C:\sd\stable-diffusion-webui\models\Stable-diffusion\model.ckpt.
Another popular model is Deliberate. It can be downloaded (4.2GB) here. Put it in the same folder as the other model. No need to rename the 2nd (and other) models.
After downloading both models, the directory should look like this:
Stable Diffusion 1.5 (SD 1.5) and Deliberate_v11 models ready for use
5 – Adjust memory limits & enable listening outside of localhost (command line arguments)
Inside the main stable-diffusion-webui directory live a number of launcher files and helper files. Find webui-user.bat and edit it (.bat files can be right-clicked -> edit).
Add –medvram (two dashes) after the equals sign of COMMANDLINE_ARGS. If you also want the UI to listen on all IP addresses instead of just localhost (don’t do this unless you know what that means), also add –listen.
webui-user.bat after edits
@echo off

set PYTHON=
set GIT=
set VENV_DIR=
set COMMANDLINE_ARGS=--listen --medvram

call webui.bat
6 – First run
The UI tool (developed by automatic1111) will automatically download a variety of requirements upon first launch. It will take a few minutes to complete. Double-click the webui-user.bat file we just edited. It calls a few .bat files and eventually launches a Python file. The .bat files are essentially glue to stick a bunch of stuff together for the main file.
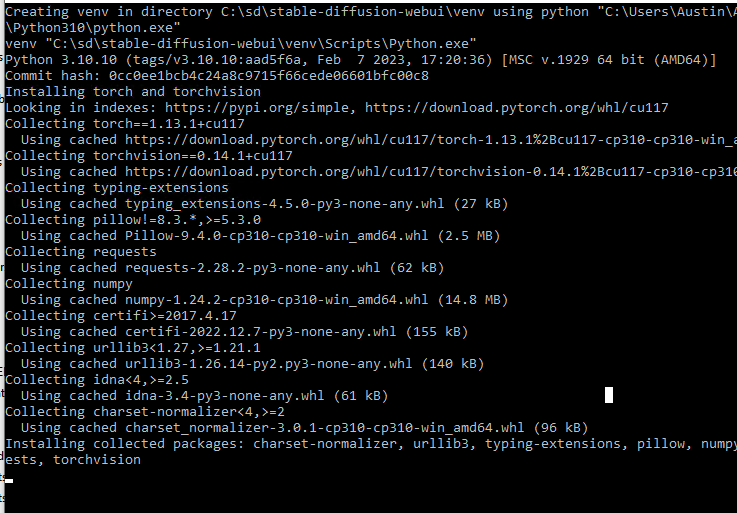
The very first thing it does is creates a Python venv (virtual environment) to keep the Stable Diffusion packages separate from your other Python packages. Then it pip installs a bunch of packages related to cuda/pytorch/numpy/etc so Python can interact with your GPU.
webui-user.bat using pip to install necessary python packages like cuda
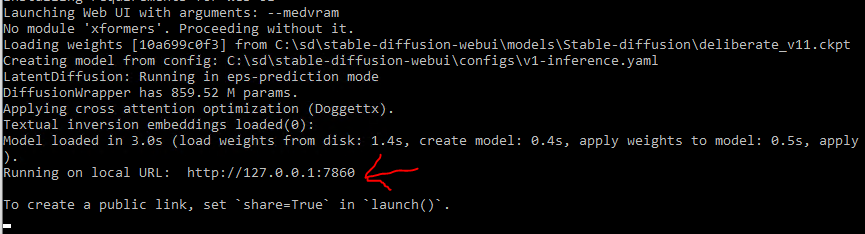
After everything is installed and ready to go, you will see a line that says: Running on local URL: http://127.0.0.1:7860. That means the Python web server UI is running on your own computer on port 7860 (if you added –listen to the launch args, it will show 0.0.0.0:7860, which means it is listening on all IP addresses and can be accessed by external machinse).
stable-diffusion-webui launched and ready to load
7 – Launching the web UI
With the web UI server running, it can be accessed via browser on the same computer running the Python at http://127.0.0.1:7860. That link should work for you if you click it.
Note that if the Python process closes for whatever reason (you close the command window, your computer reboots, etc), you need to double-click webui-user.bat to relaunch it and it needs to be running any time you want to access the web UI.
Automatic1111 stable diffusion web UI up and running
As seen in the screenshot, there are a ton of parameters/settings. I’ll highlight a few in the next section
8 – Generating Stable Diffusion images
This is the tricky part. The prompts make or break your generation. I am still learning. The prompt is where you enter what you want to see. Negative prompt is where you enter what you don’t want to see.
Let’s start simple, with cat in the prompt. Then click generate. A very reasonable-looking cat should soon appear (typically takes a couple seconds per image):
AI-generated cat with stable diffusion 1.5 with default settings
To highlight a few of the settings/sliders:
Stable diffusion checkpoint – model selector. Note that it’ll take a bit to load a new model (the multi-GB files need to be read in their entirety and ingested).
Prompt – what you want to see
Negative prompt – what you don’t want to see
Sampling method – various methods to sample new points
Sampling steps – how many iterations to use for image generation for a single image
Width – width of image to generate (in pixels). NOTE, you need a very powerful GPU with a ton of VRAM to go much higher than the default 512
Height – height of image to generate (in pixels). Same warning applies as width
Batch count – how many images to include in a batch generation
Batch size – haven’t used yet, presumably used to specify how many batches to generate
CFG Scale – this slider tells the models how specific they need to be for the prompt. Higher is more specific. Really high values (>12ish) start to get a bit abstract. Probably want to be in the range of 3-10 for this slider.
Seed – random number generator seed. -1 means use a new seed for every image.
Some thoughts on prompt/negative prompt
From my ~24 hours using this tool, it is very clear that prompt/negative prompts are what make or break your generation. I think that your ability as a pre-AI artist would come in handy here. I am no artist so I have a hard time putting what I want to see into words. Take example prompt: valley, fairytale treehouse village covered, matte painting, highly detailed, dynamic lighting, cinematic, realism, realistic, photo real, sunset, detailed, high contrast, denoised, centered. I would’ve said “fairytale treehouse” and stopped at that. Compare the two prompts below with the more detailed prompt directly below and the basic “fairytale treehouse” prompt after that:
AI-generated “fairytale treehouse” via stable diffusion. Prompt: valley, fairytale treehouse village covered, matte painting, highly detailed, dynamic lighting, cinematic, realism, realistic, photo real, sunset, detailed, high contrast, denoised, centeredAI-generated “fairytale treehouse” via stable diffusion. Prompt: fairytale treehouse
One of these looks perfectly in place for a fantasy story. The other you could very possibly see in person in a nearby forest.
Both positive and negative can get very long very quickly. Many of the AI-generated artifacts present over the last month or two can be eliminated with negative prompt entries.
I will not pretend to know what works well vs not. Google is your friend here. I believe that “prompt engineering” will be very important in AI’s future. Google is your friend here.
Conclusion
AI-generated content is here. It will not be going away. Even if it is outlawed, the code is out there. AI will be a huge part of our future, regardless of if you want it or not. As the saying goes – pandora’s box is now open.
I figured it was worth trying. The guide this is based off made it relatively easy for me (but I do have above-average computer skill), and I wanted to make it even easier. Hopefully you found this ‘how to set up stable diffusion’ guide easy to use as well. Please let me know in the comments section if you have any questions/comments/feedback – I check at least daily!
Resources
Huge shout out to whoever wrote the guide (“all anons”) at https://rentry.org/voldy. That is essentially where this entire guide came from.