I intend to use this site to document my journey down the path of nerdiness (past, present, and future). I’ve been learning over the years from various sites like what I hope this one becomes, and want to give back. I have a wide variety of topics I’d like to cover. At a minimum, posting about my activities will help me document what I learned to refer back in the future. I’ll also post about projects we do ourselves around the house instead of hiring professionals, saving big $$$$ in the process. Hope you enjoy the journey with me!
Below are some topic I plan on covering (I’ve already done something with every one of these and plan on documenting it):
RTL-SDRs (receiving signals from your electric meter, ADS-B, general radio stuff)
Virtual machines and my homelab setup
Home automation / smart home (Home Assistant, Tasmota, Phillips Hue bulbs, automating various tasks throughout the house)
My mini solar setup (2x300W panels) and not-so-mini battery backup (8x272Ah LiFePO4 batteries – should yield 7ish kWh of storage)
Remote control aircraft running Arduplane with video downlink and two-way telemetry
General computer stuff (building them, what I use mine for, Hyper-V)
Home network (Ubiquiti setup, VLANs, wiring the house with CAT6, IP security cameras on Blue Iris)
Formation of my LLC if anyone wants to hear about that
In the last two PPS posts (the original in 2021 and the revisit in 2025), we explored how to get microsecond-accurate time with a Raspberry Pi and a GPS module that outputs a once-per-second pulse (PPS). That project was a ton of fun—and borderline overkill for most home setups—but it got us into the realm of microseconds! Now we’re going to shoot for yet another SI prefix leap and aim for nanosecond accuracy. That’s 1 ns = 0.000000001 seconds (alternatively, it means there are 1 billion nanoseconds in one second).
How? By using the Precision Time Protocol (PTP, IEEE 1588). PTP is designed for high-precision time synchronization over a network, commonly used in financial trading, industrial control, and telecom environments. With the right hardware and configuration, you can synchronize clocks across your devices to within hundreds of nanoseconds with common homelab gear. Is the title a little misleading? Maybe, but technically it still makes sense to use the nano prefix for the numbers that we’re talking about here (anything >1000 nanoseconds should probably be referred to in microseconds).
To be clear, the nanosecond here refers to the synchronization between devices on your network! Depending on how your Pi is set up, and the quality of it’s oscillator, it is unlikely that your Pi’s timing, as determined by the PPS signals, will be as accurate or precise as the PTP synchronization.
As always, do you need nanosecond-level timing at home? Absolutely, 100% no. But this is Austin’s Nerdy Things, so here we are (again)!
Why would you need time this accurate at home?
You don’t, at all. Even microsecond-level accuracy is already overkill for home usage. But there are some niche use cases:
Amateur radio or signal processing that needs super-tight phase alignment.
High-speed data acquisition where you want to correlate measurements with precise timestamps.
Simply pushing the limits of what’s possible because (if you read far enough back in my about me) the last four digits of my phone number spell NERD (seriously. and I’ve had my phone number since I was 15.)
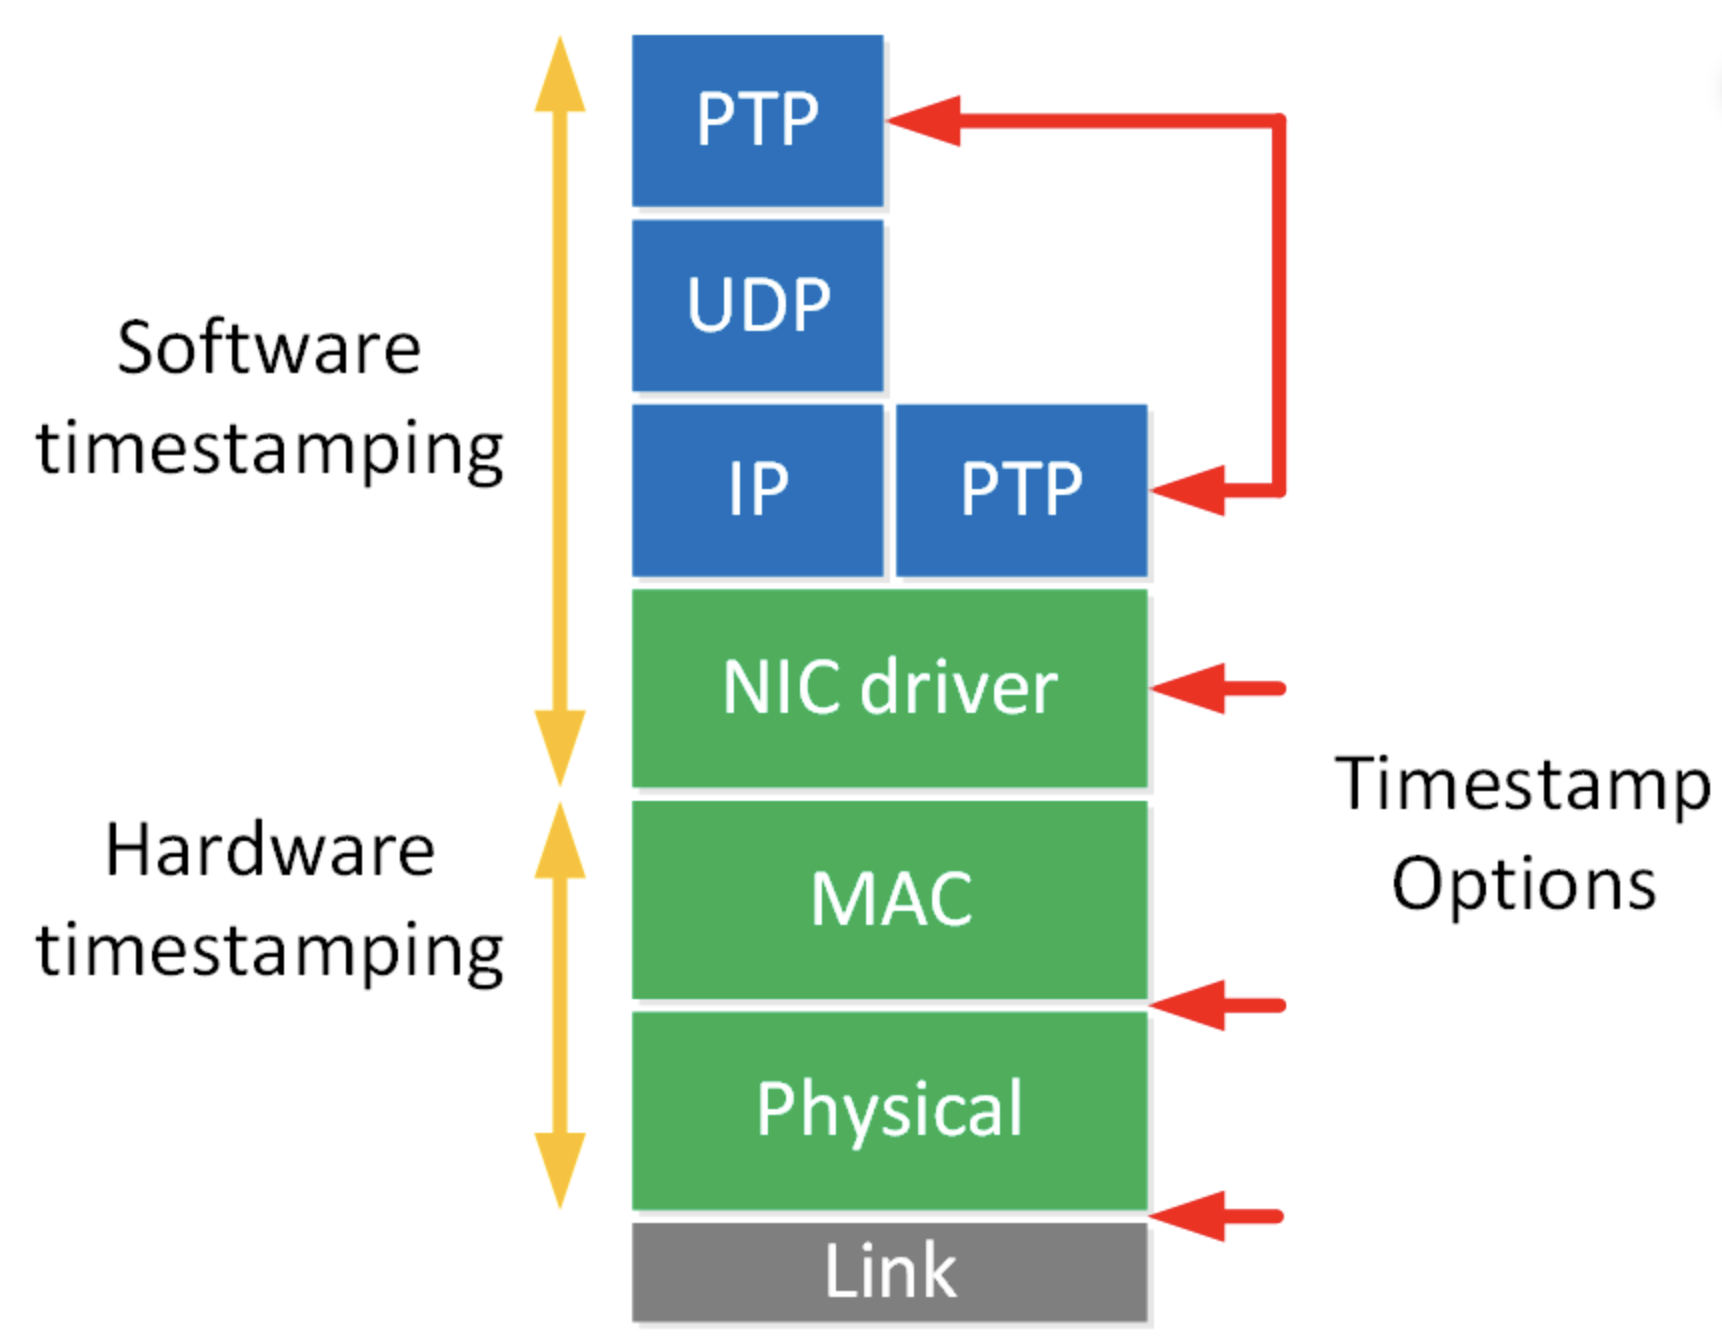
PTP can outperform NTP by a few orders of magnitude if everything is set up correctly with hardware timestamping. With PTP, your network cards (and potentially switches) handle timestamps in hardware, avoiding much of the jitter introduced by the kernel and software layers.
Diagram showing the various places timestamping can occur in the processing of a ethernet packet, the closer to the link the better for timing purposes. Source: https://networklessons.com/ip-services/introduction-to-precision-time-protocol-ptp
Disclaimer
My experiments appear to be relatively successful but I need to get this out of the way: this level of timing is solidly into the realm of experts. I kinda sorta understand most of what’s going on here but there are a ton of super detailed nuances that go way over my head. Pretty sure some people spend a lifetime on this kind of stuff (particularly at places like the US National Institute of Standards and Technology – NIST, which is “up the street” from where I live and is one of the NTP sources I use). Nanoseconds are being reported but I have no way to verify.
Materials needed
Two machines/computers with NIC (network interface card) that have hardware timestamping – many server NICs have this, and quite a few “prosumer” Intel NICs do too (examples: i210, i340, i350, some i225/i226), and, essential for the revisiting PPS NTP post, Raspberry Pi 5s do too. PTP is also known as IEEE 1588, which is the PTP standard, so you may see either on datasheets.
A very local area network. From what I’ve read, this won’t work well over a WAN, especially if there is asymmetric latency (a typical homelab network, even across a couple switches, will be fine)
A machine with highly accurate time (perhaps from PPS GPS sync) to be used as the “grandmaster”, which is PTP-speak for server.
Procedure
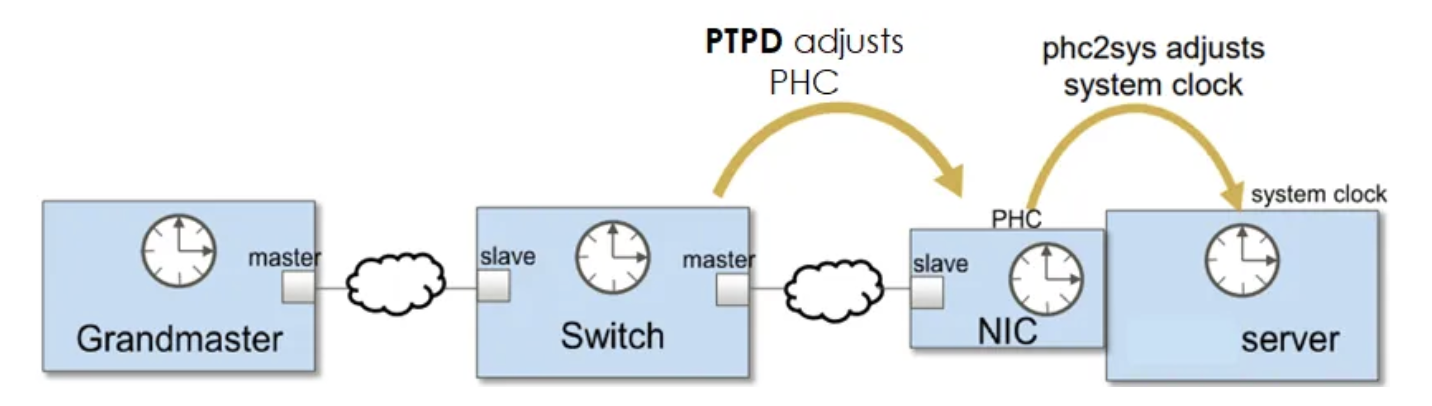
The general procedure will be to set up the server first, which involves syncing the PHC (physical hardware clock) of the NIC to the system clock, which is discipline from elsewhere. After the PHC is synchronized to the system clock, we will use linuxptp (ptp4l) to act as a server. After that, we will essentially do the opposite on any client machines – synchronize the PHC from the PTP grandmaster, and then sync the system clock with the PHC.
0 – Ensure your NIC supports hardware timestamps
Run ethtool to check if your NIC supports hardware timestamps. The format is ethtool -T [nic name]. My NIC is named enp0s31f6 so I will use that. This is a I219-LM in a Dell Optiplex 7040 which is not exactly new but works very well as a Proxmox Backup Server.
ethtool -T enp0s31f6
root@pbs:~# ethtool -T enp0s31f6
Time stamping parameters for enp0s31f6:
Capabilities:
        hardware-transmit
        software-transmit
        hardware-receive
        software-receive
        software-system-clock
        hardware-raw-clock
PTP Hardware Clock: 0
Hardware Transmit Timestamp Modes:
        off
        on
Hardware Receive Filter Modes:
        none
        all
        ptpv1-l4-sync
        ptpv1-l4-delay-req
        ptpv2-l4-sync
        ptpv2-l4-delay-req
        ptpv2-l2-sync
        ptpv2-l2-delay-req
        ptpv2-event
        ptpv2-sync
        ptpv2-delay-req

root@pbs:~# ip l
1: lo: <LOOPBACK,UP,LOWER_UP> mtu 65536 qdisc noqueue state UNKNOWN mode DEFAULT group default qlen 1000
    link/loopback 00:00:00:00:00:00 brd 00:00:00:00:00:00
2: enp0s31f6: <BROADCAST,MULTICAST,UP,LOWER_UP> mtu 1500 qdisc pfifo_fast state UP mode DEFAULT group default qlen 1000
    link/ether 48:4d:7e:db:98:6b brd ff:ff:ff:ff:ff:ff

root@pbs:~# lspci | grep Ether
00:1f.6 Ethernet controller: Intel Corporation Ethernet Connection (2) I219-LM (rev 31)
The lines to look for are in the capabilities section
hardware-transmit
hardware-receive
We have those so we’re good to go on the client side. I haven’t explored those hardware receive filter modes yet but they look interesting.
The server is the Raspberry Pi 5 which shows similar output:
austin@raspberrypi5:~ $ ethtool -T eth0
Time stamping parameters for eth0:
Capabilities:
        hardware-transmit
        software-transmit
        hardware-receive
        software-receive
        software-system-clock
        hardware-raw-clock
PTP Hardware Clock: 0
Hardware Transmit Timestamp Modes:
        off
        on
        onestep-sync
Hardware Receive Filter Modes:
        none
        all
1 – Synchronize the hardware clock
First, install linuxptp on both server and client
sudo apt install linuxptp
With linuxptp installed, we will use phc2sys to synchronize the various clocks. Despite the name, phc2sys can be used to synchronize either direction (from PHC to system clock or from system clock to PHC).
With that out of the way, let’s get to the command:
# s = source
# c = destination, replace with your NIC name
# O = offset, PTP traditionally uses TAI, which doesn't use leap seconds and as of Feb 2025, is 37 seconds off of UTC, 0 means use whatever system clock is using
# step_threshold means any delta above this amount should just be jumped instead of slowly shifted by fast/slow frequency
# m = print out status messages
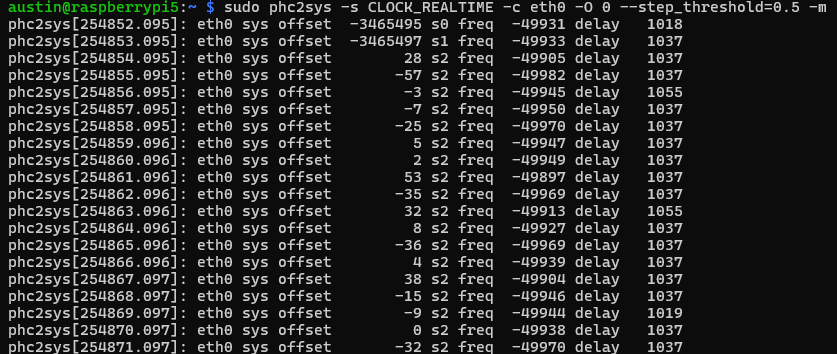
sudo phc2sys -s CLOCK_REALTIME -c eth0 -O 0 --step_threshold=0.5 -m
And the results:
screenshot of phc2sys synchronizing the PHC of a Raspberry Pi 5 NIC with the system clock
Here we see three fields with numbers (offset/delay in nanoseconds and freq in parts per billion (ppb)):
Offset is how far off the PHC is from the realtime clock (starting at 3.4 million nanoseconds = 3.4 milliseconds and then stepping down to 28 nanoseconds)
Frequency is the frequency adjustment of the destination clock (in this case, the eth0 NIC PHC)
Delay is the estimated amount of time to get the message from the source to destination (which is suspiciously high for this NIC, other machines typically show much lower numbers)
Leave this running (we’ll daemon-ize things at the end).
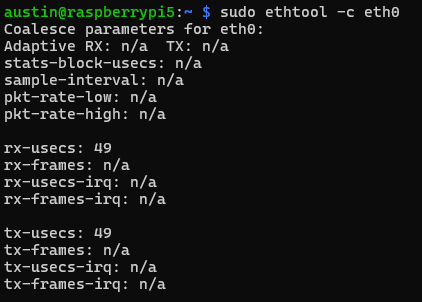
2 – Tune the Raspberry Pi 5 NIC driver to reduce latency
Raspberry Pi ethernet driver by collects packets over a period of time, which is 49 microseconds by default.
Raspberry Pi showing 49 microseconds of packet coalescing
We can reduce that to the driver minimum of 4 microseconds:
Next up is to use ptp4l to serve the time via PTP over your network.
We need a configuration file to give to ptp4l. This isn’t entirely necessary, most config items can be presented as arguments in the command line but I like config files.
Call this file whatever (perhaps ptp-gm.conf, for precision time protocol grandmaster):
[global]
# extra logging
verbose               1

# use hardware timestamping (alternative is software, which isn't nearly as accurate/precise)
time_stamping         hardware

# you can specify a "domain number", which is analogus to VLAN
#domainNumber          0

# force this node to act as a master (won't revert to slave).
masterOnly            1

# priority settings, 128 is default. lower numbers are higher priority in case there are multiple grandmasters
priority1             128

# clockClass=6 for GNSS reference
# other classes = https://documentation.nokia.com/srlinux/24-10/books/network-synchronization/ieee-1588-ptp.html
clockClass            6

# timeSource is where time comes from - 0x10 is "atomic clock" which is a bit sus for us but not ultimately wrong
# https://support.spirent.com/csc30/s/article/FAQ14011
timeSource            0x10

# log output to a file, summary interval is 2^x, so 1 = 2^1 = every 2 seconds
# can also output with -m
# summary_interval     1
# logfile             /var/log/ptp4l.log
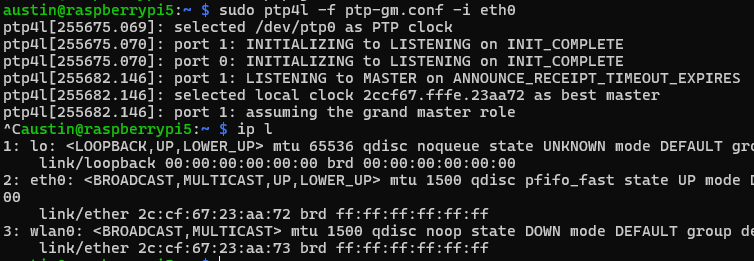
Now run ptp4l also!
sudo ptp4l -f ptp-gm.conf -i eth0
You’ll see some outputs around getting things set up and running. Key things to look for “selected local clock … as best master” and “assuming grand master role”. The MAC shown is actually from the NIC.
Raspberry Pi 5 acting as PTP grandmaster, using the physical hardware clock of the NIC as the “local clock”, which is synchronized with the realtime clock via phc2sys which is synchronized via PPS/GPS.
Now we are ready to serve this time to clients.
4 – Receive PTP over the network
To get PTP over the network, you can use NICs that support software timestamping but we’re going for higher accuracy/precision than that so select a machine that has a NIC that supports PTP/IEEE 1588 (see step 0 for reference).
Setting system time via PTP is really a two step process – synchronizing the NIC PHC with PTP and then using phc2sys to synchronize the system clock with the PHC. If you are thinking this sounds similar to the end of step 2, you are correct, it is just in reverse for the clients.
Diagram showing the source -> PHC -> system clock -> PTP -> network -> PTP -> PHC -> system clock flow. Source: https://latency-matters.medium.com/be-back-on-time-b3267f62d76a
And you will start seeing some init messages followed by some statistics scrolling past:
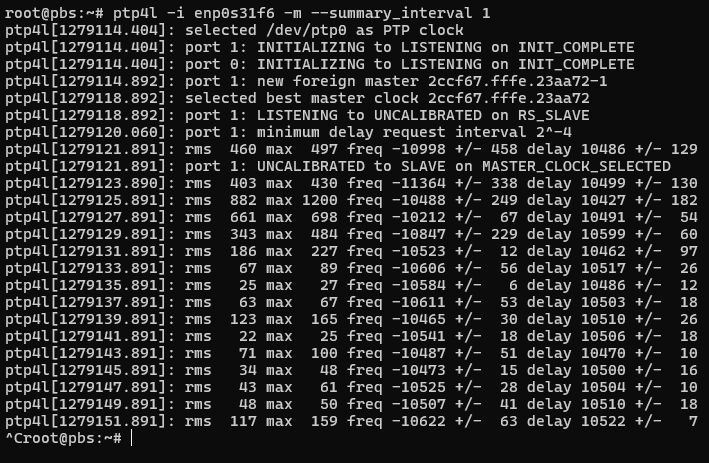
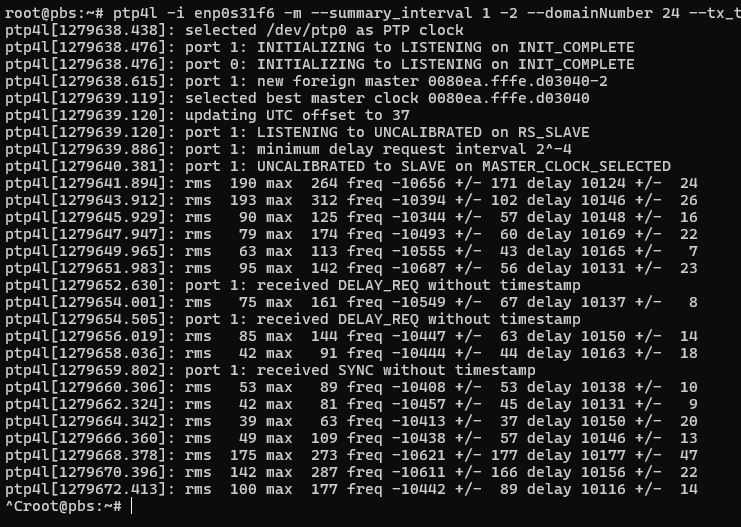
ptp4l as slave showing double-digit nanosecond synchronization
The output looks a bit different if there are more requests/polls than summary outputs – RMS will be added, which is root mean squared error, along with max error, and some +/- indicators on the frequency and delay. That delay is still suspicious…
We see here that we have achieved double-digit nanosecond synchronization across the network!
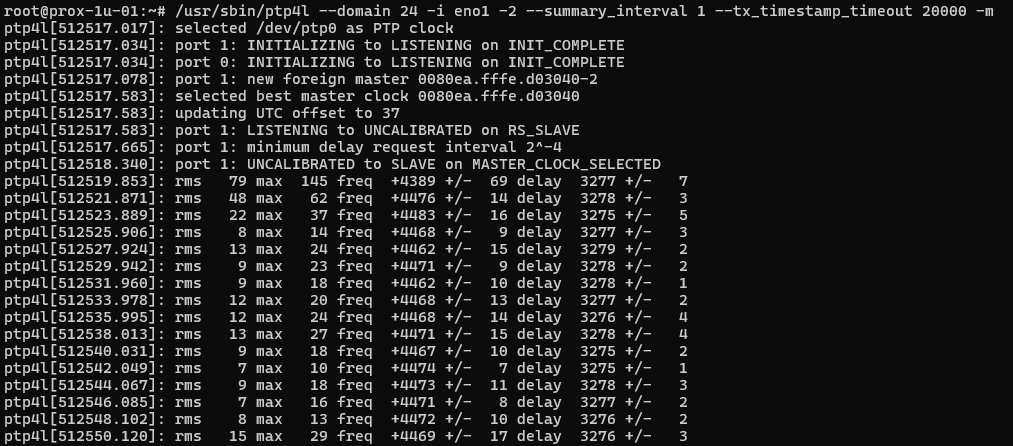
Now compare to a Supermicro Xeon v4 server running Intel i350 NICs synchronizing to a OSA 5401 SyncPlug – super stable and tight precision.
ptp4l as slave showing single-digit nanosecond synchronization
The OSA 5401 has an oscillator rated to 1 ppb, and is exceptionally stable. That is half of the equation – the i350 is certainly better than the i219, but probably not by orders of magnitude like the OSA 5401 is.
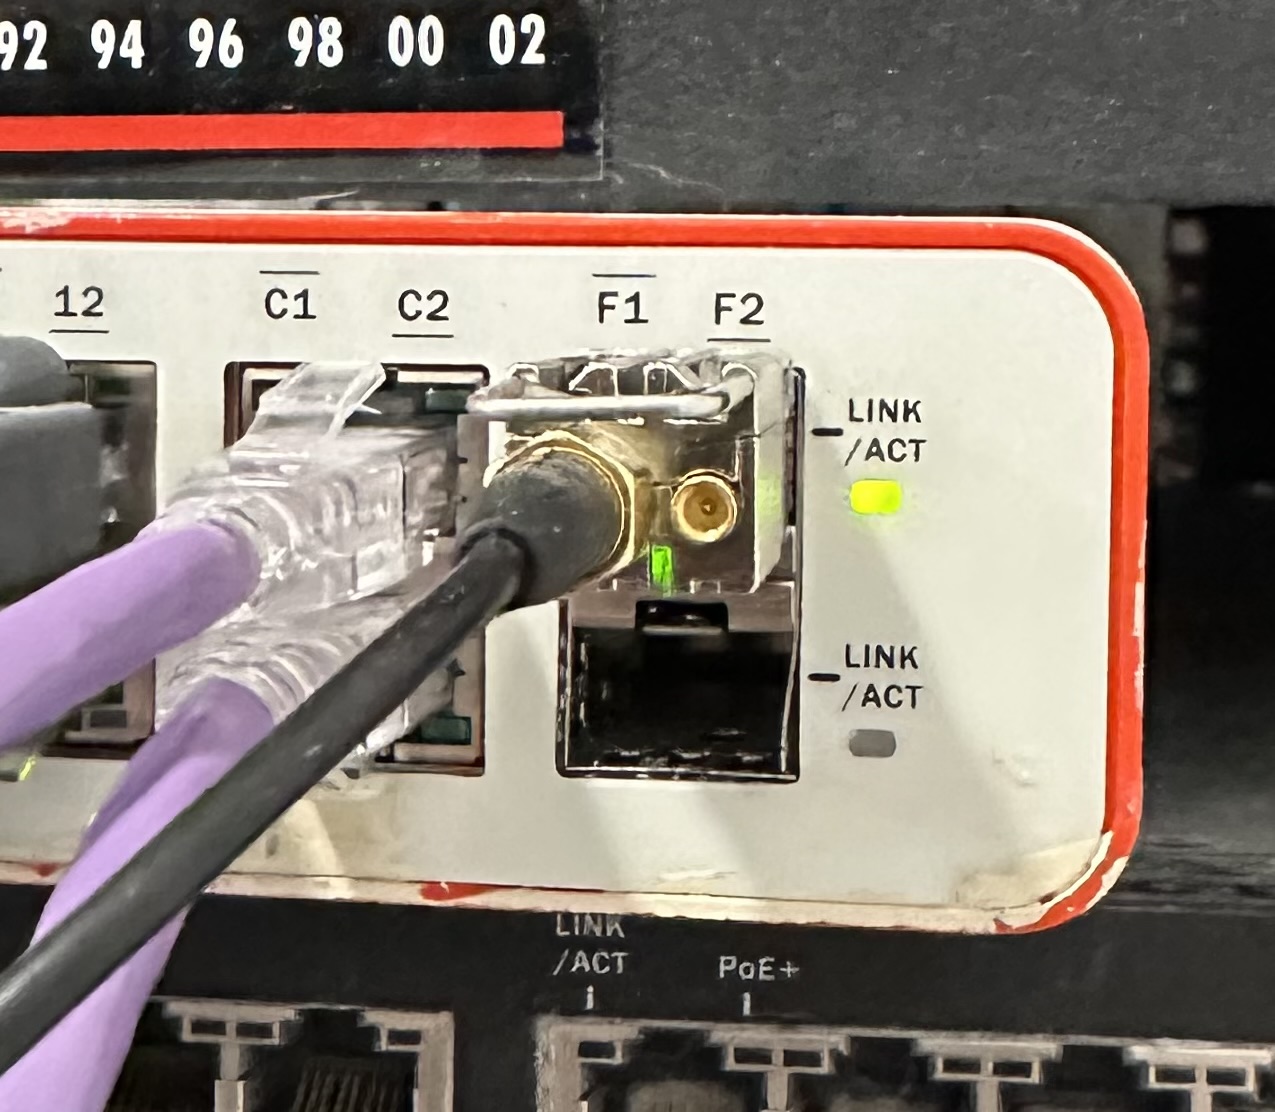
Oscilloquartz OSA 5401 SyncPlug in a Brocade switch with GPS antenna connected to it’s SMA port, showing the once per second green LED lit. Bet you’ve never seen a GPS antenna port on a SFP module before. This is a complete computer in the SFP module.
Actually, I can try synchronizing the i219-LM to the syncplug. Long story short on this, I use ethernet layer 2 on this system (not layer 3) because the proxmox hosts share their NICs and it was just how I did it originally. I also use domain number = 24 because that’s what the OSA 5401 came with from eBay.
We can see it is a little bit better, but still not nearly as good as the i350. I am now tempted to try my Solarflare/Mellanox NICs, especially since the one I just looked at in my cupboard has u.fl connectors for both PPS in and out… topic for a future post.
With the PHC of the client system synchronized, we are 3/4 of the way to completion. Last up – setting the system clock from the PHC.
5 – Setting client clock from PHC
I originally just use the PHC in Chrony as a source. This will work well. Through my research for this post, I saw that it also possible to share a memory segment from ptp4l to Chrony. I like just using the PHC so we’ll use that approach here.
Add this line to your chrony config:
refclock PHC /dev/ptp0 poll 0 dpoll -5 tai
The poll = 0 means poll the source every second, dpoll -5 means query the source many times per second (2^-5 = 32 hz), and tai is the 37 second offset.
Restart chrony
sudo systemctl restart chrony
After a minute or so check Chrony’s sources with – chronyc sources:
We can see that Chrony has successfully selected the PHC and has synchronized the system clock with it to within one single nanosecond!
6 – Serving PTP to other clients
You can of course repeat the process for N other clients. Alternatively, you can just have Chrony use hardware timestamps and enable the F323 experimental field. That enables some NTPv5 features that help a ton with synchronization. There is also a F324 field that I haven’t tried that appears to run PTP over NTP packets.
The relevant lines from my Chrony config:
peer 10.98.1.172 minpoll 0 maxpoll 0 iburst xleave extfield F323
peer 10.98.1.174 minpoll 0 maxpoll 0 iburst xleave extfield F323

# use tai if synchronized to a true TAI source, which ignores leap seconds
refclock PHC /dev/ptp0 poll 0 dpoll -5 tai prefer trust

allow all

hwtimestamp *
And if you don’t want to mess with Chrony and just want to synchronize your system clock directly from the PHC on your clients – /etc/systemd/system/phc2sys-client.service
sudo systemctl daemon-reload
sudo systemctl enable ptp4l-client.service
sudo systemctl enable phc2sys-client.service  # If not using Chrony
sudo systemctl start ptp4l-client.service
sudo systemctl start phc2sys-client.service   # If not using Chrony
Conclusion
We’ve come a long way in our pursuit of precise timing – from using GPS PPS signals for microsecond accuracy to achieving nanosecond-level synchronization with PTP. While this level of precision is absolutely overkill for most home setups (as was the microsecond timing from our previous adventures), it demonstrates what’s possible with relatively accessible hardware like the Raspberry Pi 5 and common Intel NICs.
The key takeaways from this exploration:
PTP with hardware timestamping can achieve double-digit nanosecond synchronization even with consumer-grade hardware
The quality of your network interface cards matters significantly – as we saw comparing the i219-LM, i350, and the OSA 5401
Simple optimizations like adjusting packet coalescing can have meaningful impacts on timing precision
Modern tools like Chrony make it relatively straightforward to integrate PTP into your existing time synchronization setup
For those interested in pushing timing precision even further, there are still frontiers to explore – from specialized timing NICs to advanced PTP profiles. But for now, I think I’ll stop here and enjoy my massively overengineered home time synchronization setup. At least until the next timing-related rabbit hole comes along…
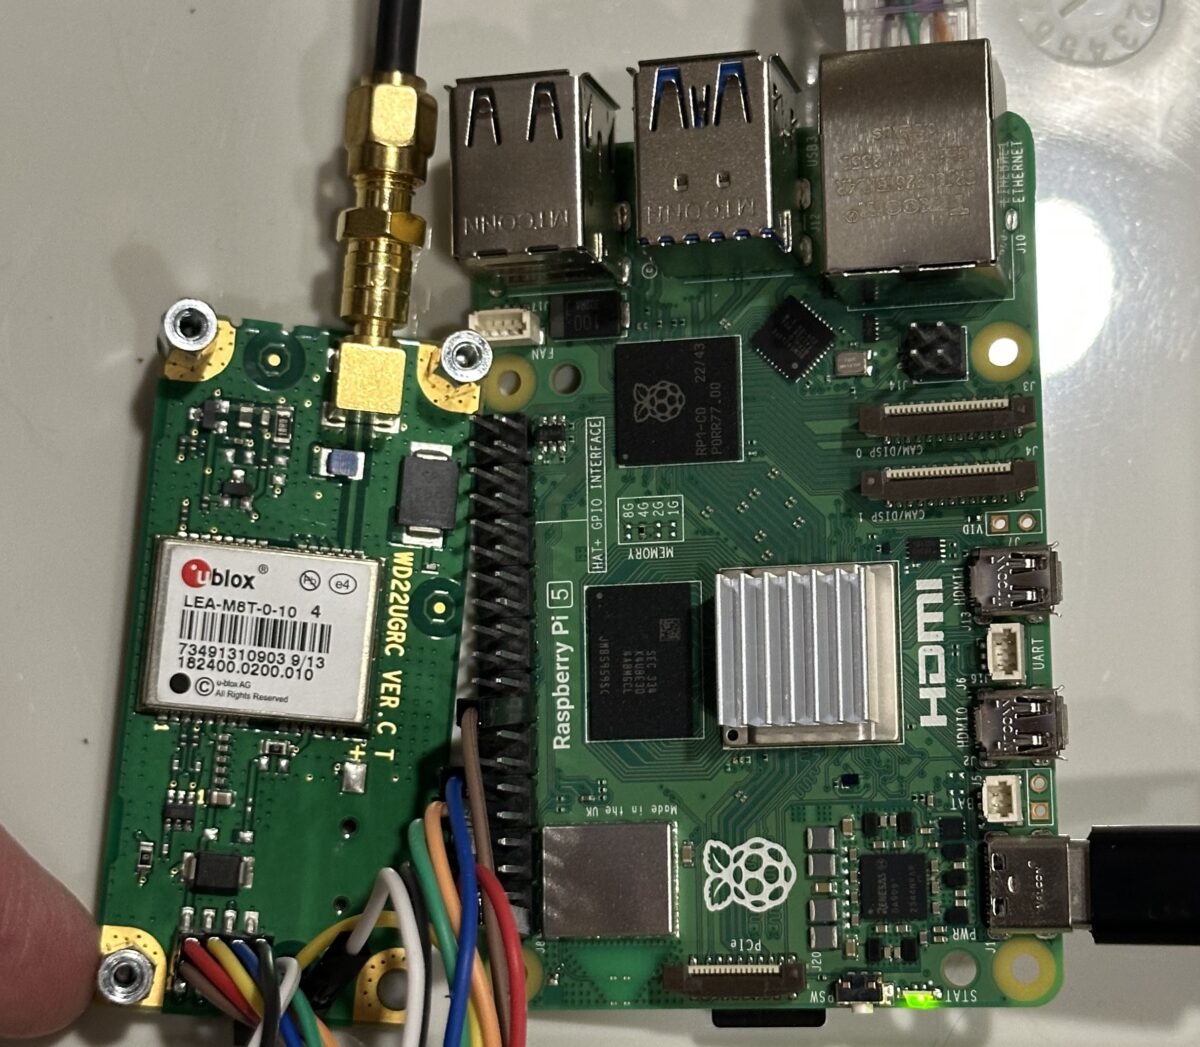
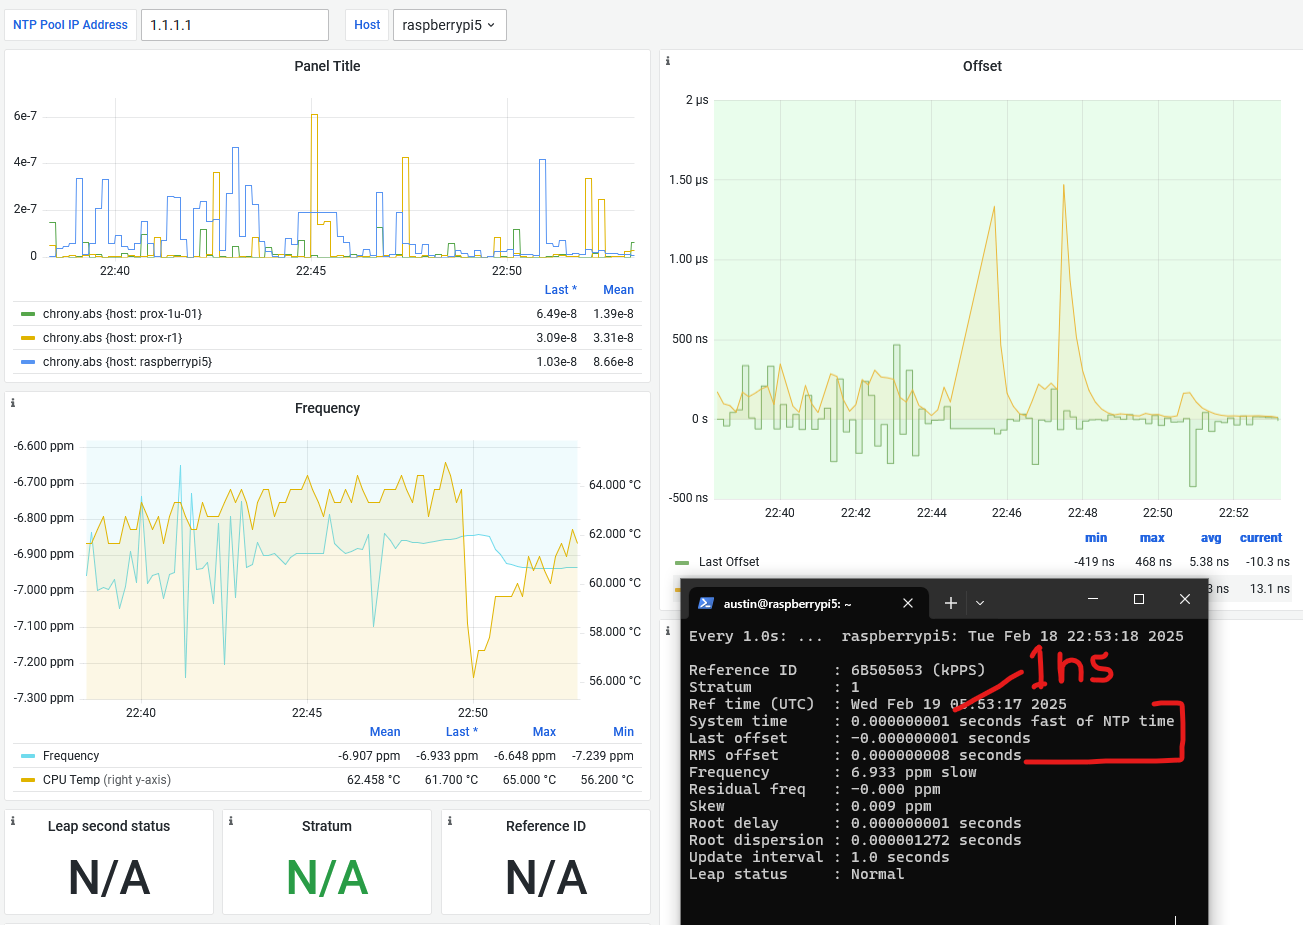
ublox LEA-M8T sending PPS signals to Raspberry Pi 5 for extremely precise timingtesting various Chrony/ublox configurations evening of Feb 18 2025 – acheived 1 nanosecond (1 nanosecond = 0.000000001 seconds) accuracy! this was a somewhat lucky capture but the Pi is routinely in single digits, and skew hovers around 0.001-0.002 ppm error, which is 1-2 ppb error on the Pi clock
Original Introduction
Lots of acronyms in that title. If I expand them out, it says – “microsecond accurate network time protocol with a Raspberry Pi and global positioning system pulse per second”. What it means is you can get super accurate timekeeping (1 microsecond = 0.000001 seconds) with a Raspberry Pi and a GPS receiver that spits out pulses every second. By following this guide, you will your very own Stratum 1 NTP server at home!
Why would you need time this accurate at home?
You don’t. There aren’t many applications for this level of timekeeping in general, and even fewer at home. But this blog is called Austin’s Nerdy Things so here we are. Using standard, default internet NTP these days will get your computers to within 2-4 milliseconds of actual time (1 millisecond = 0.001 seconds). Pretty much every internet connected device these days has a way to get time from the internet. PPS gets you to the next SI prefix in terms of accuracy (milli -> micro), which means 1000x more accurate timekeeping. With some other tricks, you can get into the nanosecond range (also an upcoming post topic!).
Materials Needed
Raspberry Pi 5 – the 3’s ethernet is hung off a USB connection so while the 3 itself can get great time, it is severely limited in how accurate other machines can sync to it. Raspberry Pi 4 would work decently. But Raspberry Pi 5 supports Precision Time Protocol (PTP), which can get synchronizations down to double-digit nanoseconds. So get the 5. Ideally, your Pi isn’t doing much other than keeping time, so no need to get one with lots of memory.
A timing-specific GPS module – these have algorithms tuned to provide extremely precise PPS signals. For example, by default, they prefer satellites with higher elevations, and have special fixed position modes where they know they aren’t moving so they focus on providing the best time possible. u-blox devices, for instance, have a “survey-in” mode where the positions are essentially averaged over a specified amount of time and standard deviations to a singular, fixed location. Other options:
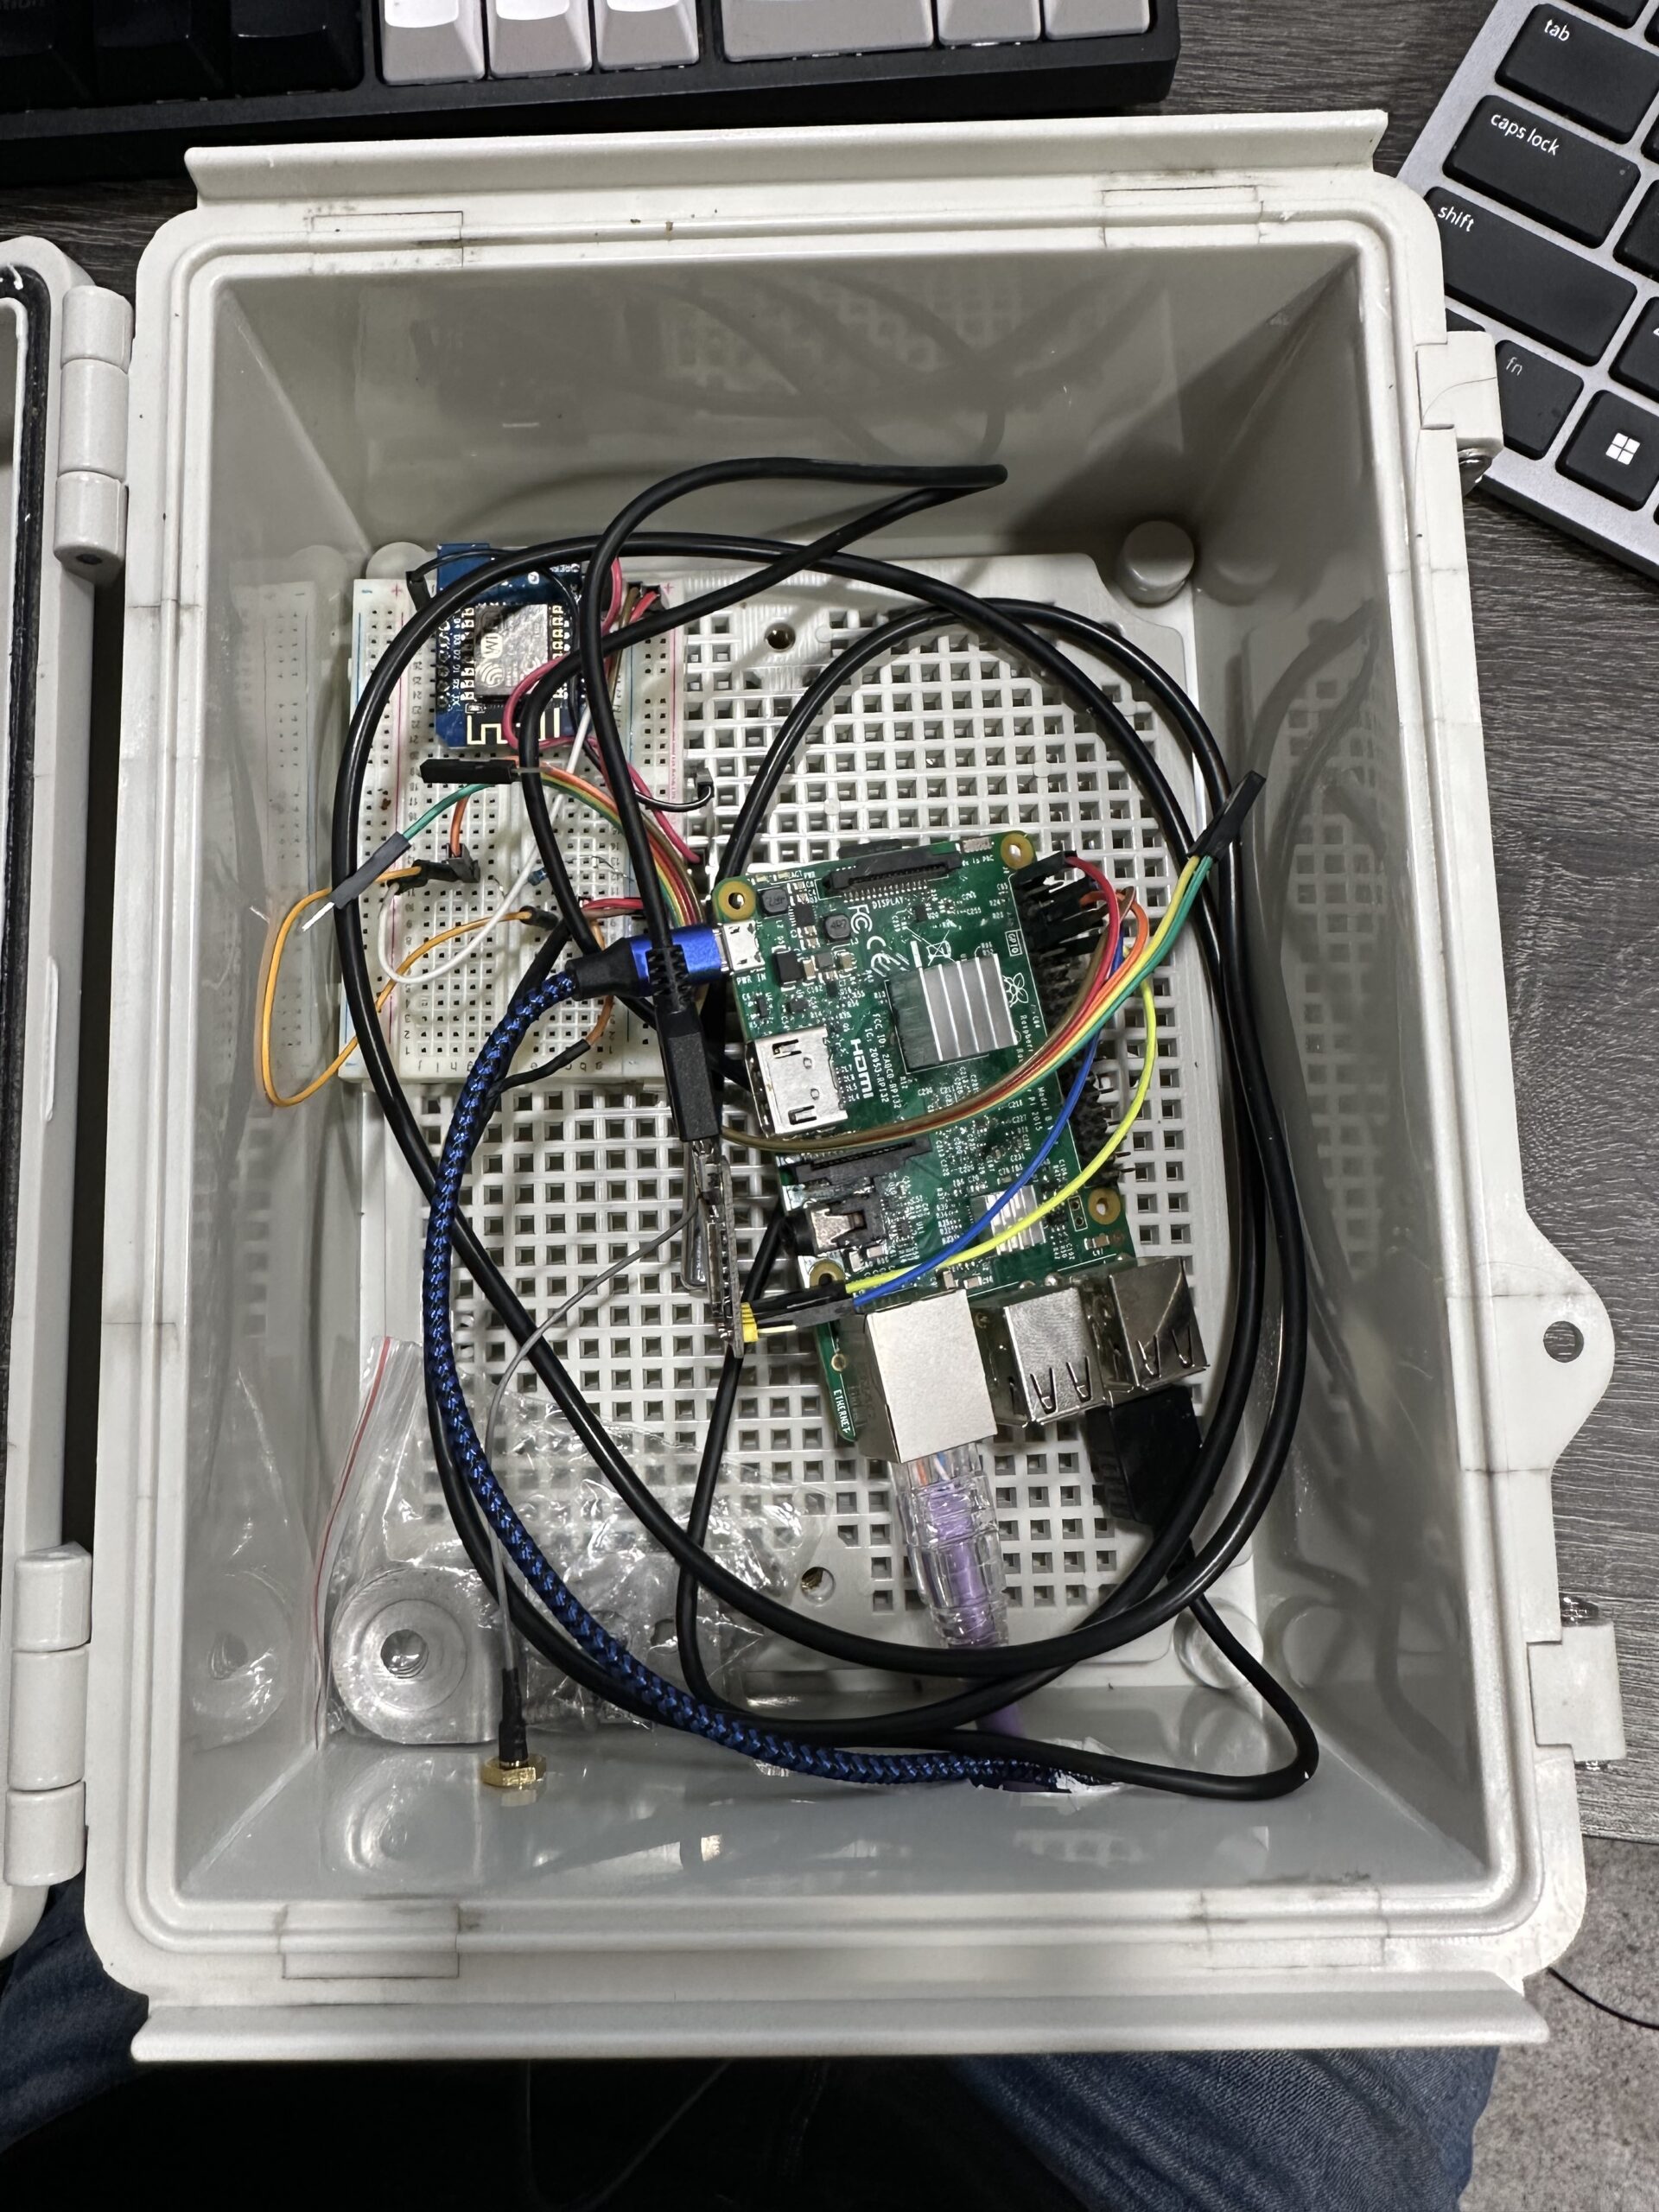
project box to stuff it all in – Temperature stability is super important for accurate time. There is a reason some of most accurate oscillators are called oven controlled crystal oscillators (OCXO) – they are extremely stable. This box keeps airflow from minutely cooling/heating the Pi.
I did say “stuffed” right? not joking here… I stuffed some newspaper on top to minimize airflow then closed it up. caption: raspberry pi for timing with PPS GPS NTP in project box with ds18b20 temperature sensor
Steps
0 – Update your Pi and install packages
This NTP guide assumes you have a Raspberry Pi ready to go.
You should update your Pi to latest before basically any project. We will install some other packages as well. pps-tools help us check that the Pi is receiving PPS signals from the GPS module. We also need GPSd for the GPS decoding of both time and position (and for ubxtools which we will use to survey-in). I use chrony instead of NTPd because it seems to sync faster than NTPd in most instances and also handles PPS without compiling from source (the default Raspbian NTP doesn’t do PPS) Installing chrony will remove ntpd.
sudo apt update
sudo apt upgrade
# this isn't really necessary, maybe if you have a brand new pi
# sudo rpi-update
sudo apt install pps-tools gpsd gpsd-clients chrony
1 – Add GPIO and module info where needed
In /boot/firmware/config.txt (changed from last post), add ‘dtoverlay=pps-gpio,gpiopin=18’ to a new line. This is necessary for PPS. If you want to get the NMEA data from the serial line, you must also enable UART and set the initial baud rate.
########## NOTE: at some point, the config file changed from /boot/config.txt to /boot/firmware/config.txt

sudo bash -c "echo '# the next 3 lines are for GPS PPS signals' >> /boot/firmware/config.txt"
sudo bash -c "echo 'dtoverlay=pps-gpio,gpiopin=18' >> /boot/firmware/config.txt"
sudo bash -c "echo 'enable_uart=1' >> /boot/firmware/config.txt"
sudo bash -c "echo 'init_uart_baud=9600' >> /boot/firmware/config.txt"
In /etc/modules, add ‘pps-gpio’ to a new line.
sudo bash -c "echo 'pps-gpio' >> /etc/modules"
Reboot
sudo reboot
Let’s also disable a bunch of stuff we don’t need:
2 – wire up the GPS module to the Pi
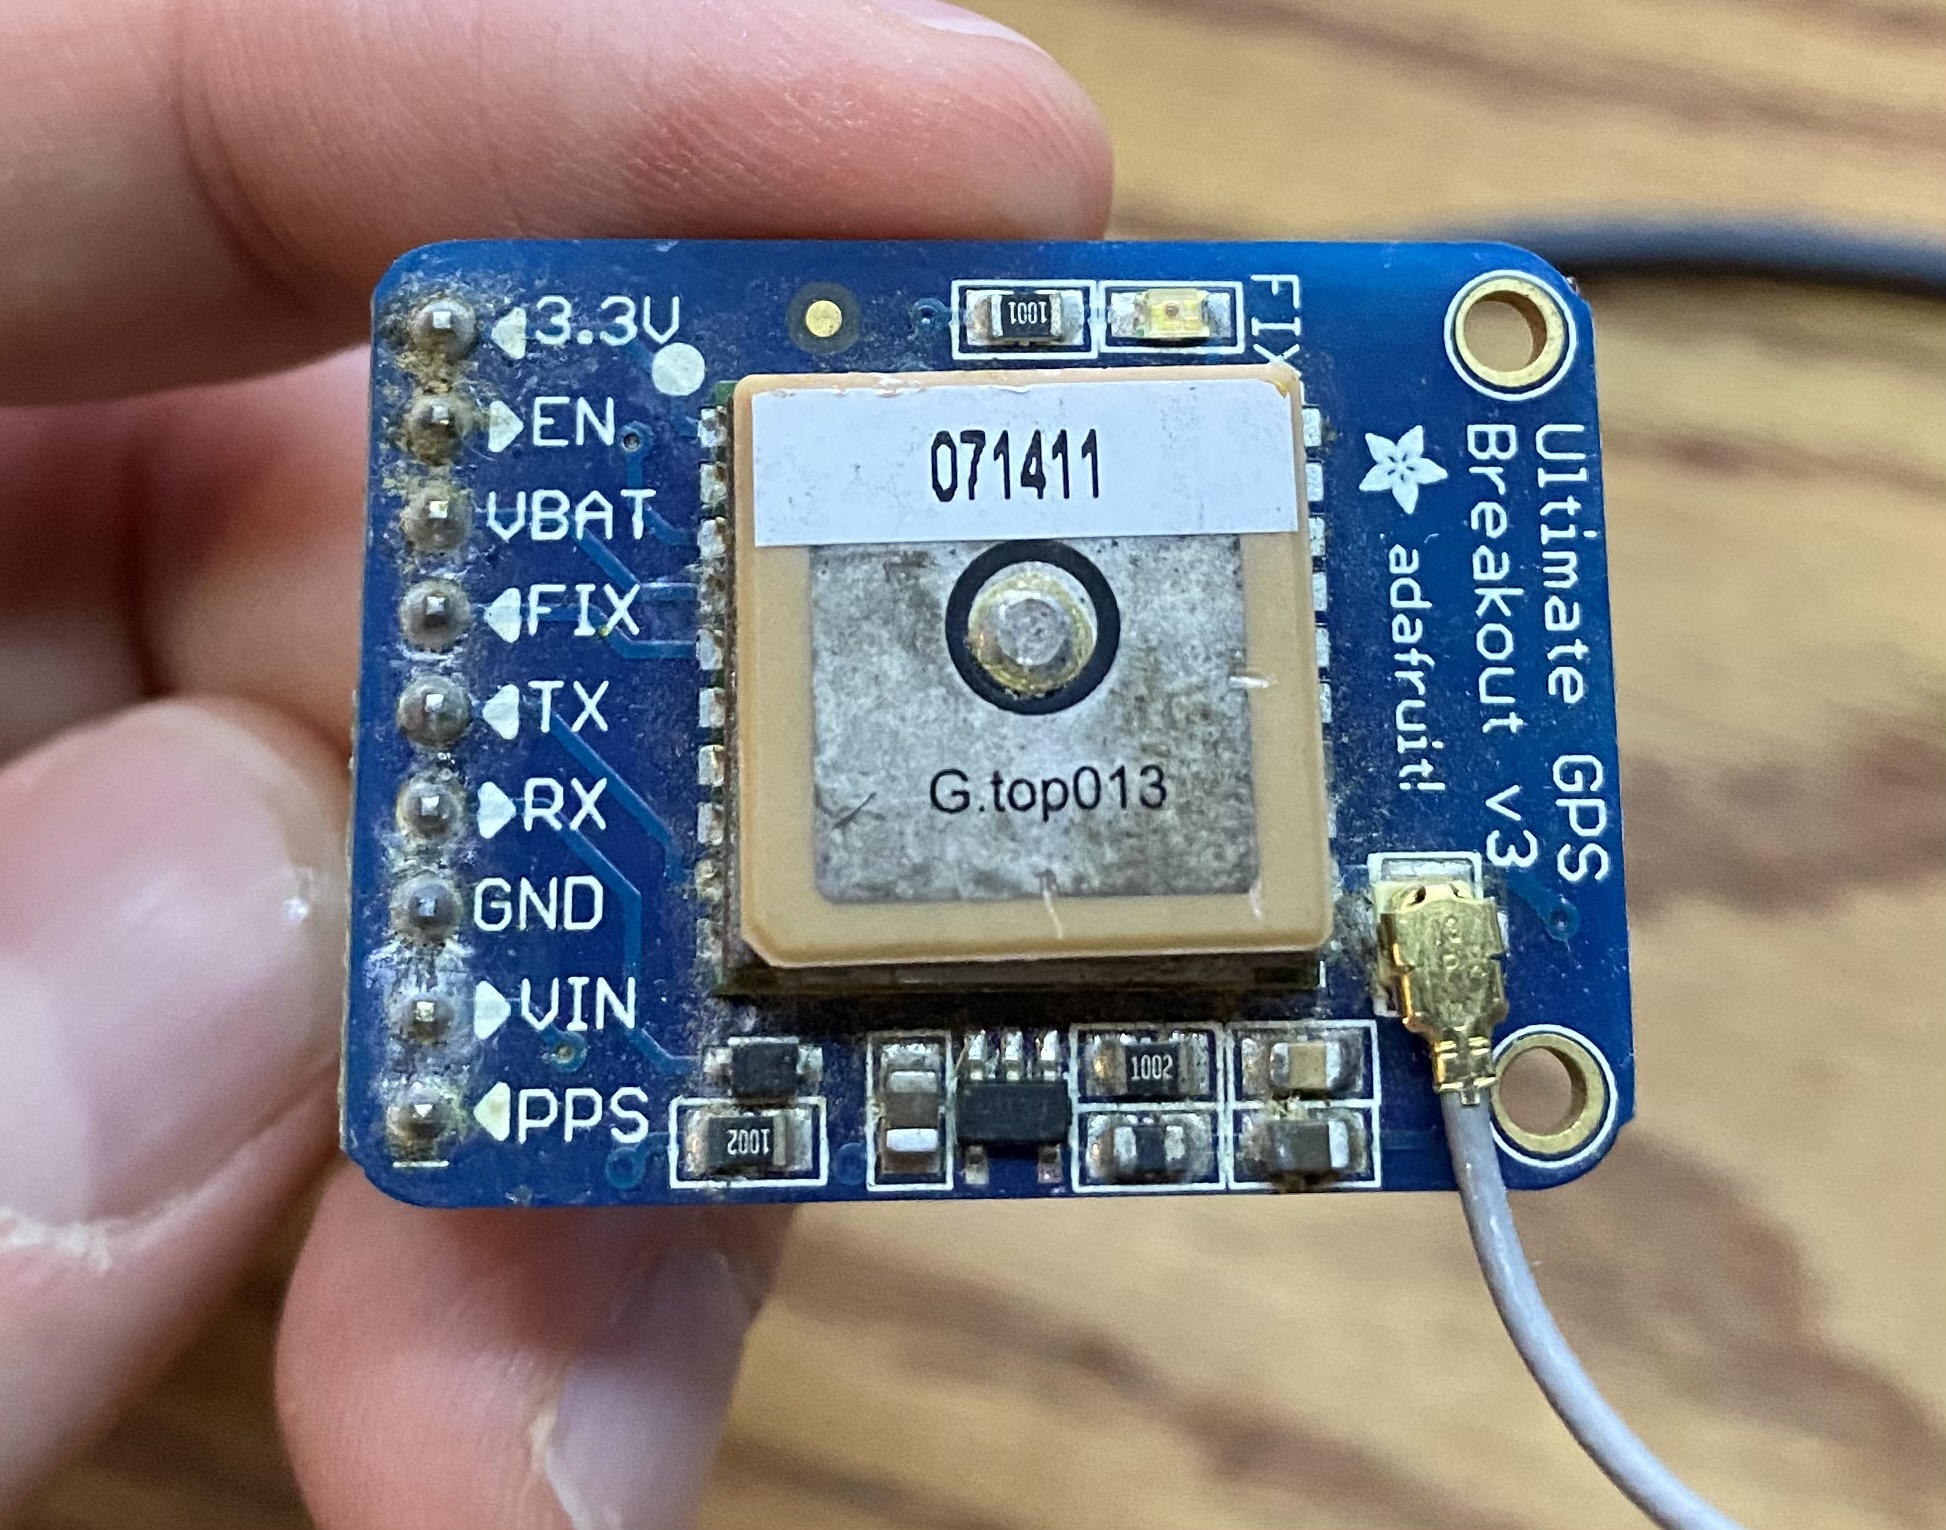
Disclaimer – I am writing this guide with a combination of Raspberry Pi 4/5 and Adafruit Ultimate GPS module, but will swap out with the LEA-M8T when it arrives.
Pin connections:
GPS PPS to RPi pin 12 (GPIO 18)
GPS VIN to RPi pin 2 or 4
GPS GND to RPi pin 6
GPS RX to RPi pin 8
GPS TX to RPi pin 10
see 2nd picture for a visual
Adafruit Ultimate GPS Breakout V3
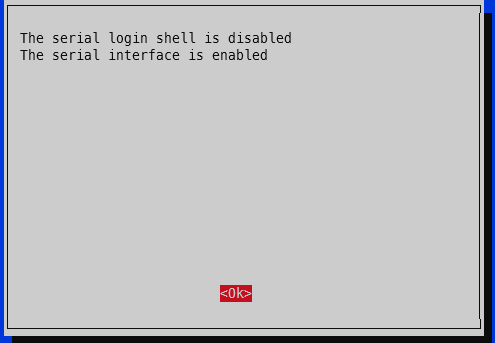
3 – enable serial hardware port
Run raspi-config -> 3 – Interface options -> I6 – Serial Port -> Would you like a login shell to be available over serial -> No. -> Would you like the serial port hardware to be enabled -> Yes.
screenshot showing raspberry serial port (UART) enabled
4 – verify PPS
First, check that PPS is loaded. You should see a single line showing pps_gpio:
Now check for the actual PPS pulses. NOTE: you need at least 4 satellites locked on for PPS signal. The GPS module essentially has 4 unknowns – x, y, z, and time. You need three satellites minimum to solve x, y, and z and a forth for time. Exception for the timing modules – if they know their x, y, z via survey-in or fixed set location, they only need a single satellite for time!
There are a couple options we need to tweak with GPSd to ensure it is available upon boot. This isn’t strictly necessary for PPS only operation, but if you want the general NMEA time information (i.e. not just the exact second marker from PPS), this is necessary.
Edit /etc/default/gpsd:
# USB might be /dev/ttyACM0
# serial might be /dev/ttyS0

# on raspberry pi 5 with raspberry pi os based on debian 12 (bookworm)
DEVICES="/dev/ttyAMA0 /dev/pps0"

# -n means start without a client connection (i.e. at boot)
GPSD_OPTIONS="-n"

# also start in general
START_DAEMON="true"

# Automatically hot add/remove USB GPS devices via gpsdctl
USBAUTO="true"
I’m fairly competent at using systemd and such in a Debian-based system, but there’s something about GPSd that’s a bit odd and I haven’t taken the time to figure out yet. So instead of enabling/restarting the service, reboot the whole Raspberry Pi.
sudo reboot
5 – check GPS for good measure
To ensure your GPS has a valid position, you can run gpsmon or cgps to check satellites and such. This check also ensures GPSd is functioning as expected. If your GPS doesn’t have a position solution, you won’t get a good time signal. If GPSd isn’t working, you won’t get any updates on the screen. The top portion will show the analyzed GPS data and the bottom portion will scroll by with the raw GPS sentences from the GPS module.
gpsmon is a bit easier to read for timing info, cgps is a bit easier to read for satellite info (and TDOP, timing dilution of precision, a measure of how accurate the GPS’s internal time determination is).
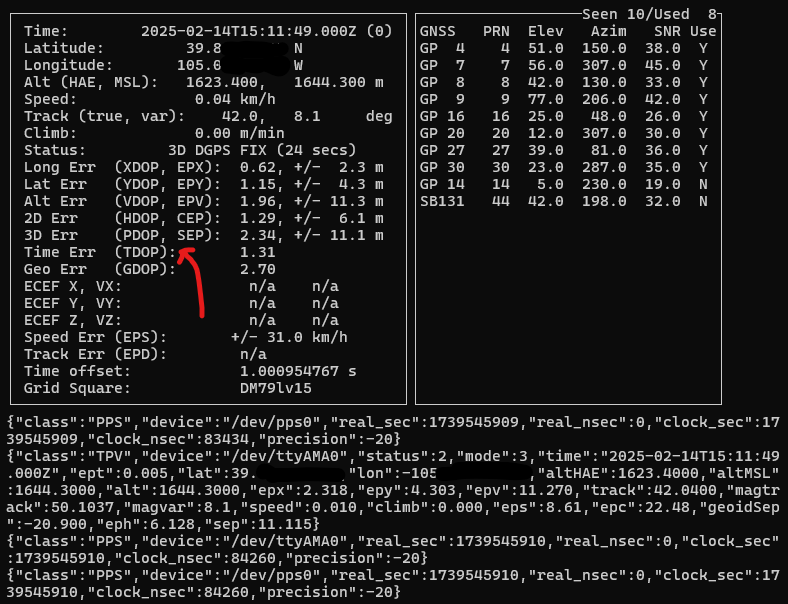
Here’s a screenshot from cgps showing the current status of my Adafruit Ultimate GPS inside my basement. There are 10 PRNs (satellites) seen, 8 used. It is showing “3D DGPS FIX”, which is the highest accuracy this module offers. The various *DOPs show the estimated errors. Official guides/docs usually say anything < 2.0 is ideal but lower is better. For reference, Arduplane (autopilot software for RC drones, planes) has a limit of 1.4 for HDOP. It will not permit takeoff with a value greater than 1.4. It is sort of a measure of how spread out the satellites are for that given measure. Evenly distributed around the sky is better for location, closer together is better for timing.
cgps
cgps showing 8 satellites used for this position determination, and a TDOP (time dilution of precision) of 1.31, which is decent. notably, cgps does not show the PPS offset
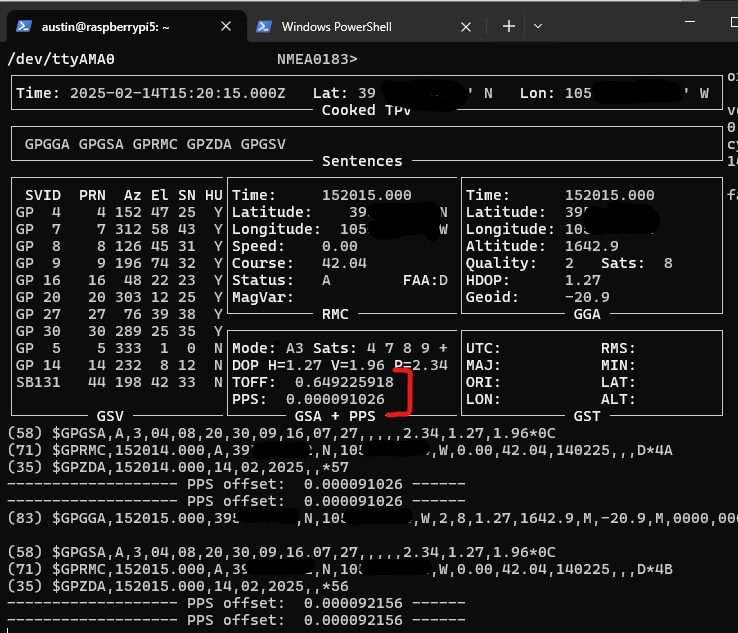
And for gpsmon, it shows both the TOFF, which is the time offset from the NMEA $GPZDA sentence (which will always come in late due to how long it takes the transmit the dozens of bytes over serial – example 79 byte sentence over 9600 bit per second link, which is super common for GPS modules = 79*(8 bits per byte + 1 start bit + 1 end bit)/9600 = 82.3 milliseconds) as well as the PPS offset. This particular setup is not actually using PPS at the moment. It also shows satellites and a few *DOPs but notably lacks TDOP.
gpsmon
gpsmon showing 8 satellites used for the position with HDOP of 1.27. This indicates a decent position solution, but doesn’t say anything about the time solution.
Both gpsmon and cgps will stream the sentences received from the GPS module.
6 – configure chrony to use both NMEA and PPS signals
Now that we know our Raspberry Pi is receiving both the precision second marker (via PPS), as well as the time of day (TOD) data (via the NMEA $GPMRC and $GPZDA sentences), let’s set up chrony to use both sources for accurate time.
This can be done as a one step process, but it is better to gather some statistics about the delay on your own NMEA sentences. So, let’s add our reference sources and also enable logging for chrony.
In the chrony configuration file (/etc/chrony/chrony.conf), add the following near the existing server directives
# SHM refclock is shared memory driver, it is populated by GPSd and read by chrony
# it is SHM 0
# refid is what we want to call this source = NMEA
# offset = 0.000 means we do not yet know the delay
# precision is how precise this is. not 1e-3 = 1 millisecond, so not very precision
# poll 0 means poll every 2^0 seconds = 1 second poll interval
# filter 3 means take the average/median (forget which) of the 3 most recent readings. NMEA can be jumpy so we're averaging here
refclock SHM 0 refid NMEA offset 0.000 precision 1e-3 poll 0 filter 3

# PPS refclock is PPS specific, with /dev/pps0 being the source
# refid PPS means call it the PPS source
# lock NMEA means this PPS source will also lock to the NMEA source for time of day info
# offset = 0.0 means no offset... this should probably always remain 0
# poll 3 = poll every 2^3=8 seconds. polling more frequently isn't necessarily better
# trust means we trust this time. the NMEA will be kicked out as false ticker eventually, so we need to trust the combo
refclock PPS /dev/pps0 refid PPS lock NMEA offset 0.0 poll 3 trust

# also enable logging by uncommenting the logging line
log tracking measurements statistics
Restart chrony
sudo systemctl restart chrony
Now let’s check to see what Chrony thinks is happening:
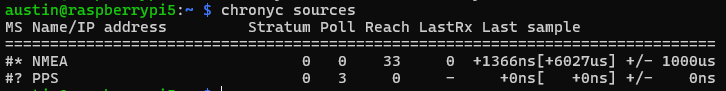
chronyc sources
This screenshot was taken seconds after restarting chrony. The * in front of NMEA means that’s the currently selected source. This make sense since the PPS source hasn’t even been polled yet (see the 0 in the reach column). The ? in front of PPS means it isn’t sure about it yet.
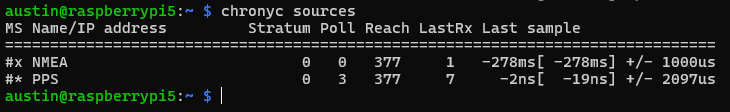
Wait a minute or two and try again.
Now Chrony has selected PPS as the currently selected source with the * in front. And the NMEA source has been marked as a “false ticker” with the x in front. But since we trusted the PPS source, it’ll remain as the preferred source. Having two sources by itself is usually not advisable for using general internet NTP servers, since if they both disagree, Chrony can’t know which is right, hence >2 is recommended.
The relatively huge estimated error is because Chrony used the NMEA source first, which was quite a bit off of the PPS precise second marker (i.e. >100 millseconds off) and it takes time to average down to a more realistic number.
Since we turned on statistics, we can use that to set an exact offset for NMEA. After waiting a bit (an hour or so), you can cat /var/log/chrony/statistics.log:
We are interested in the ‘Est offset’ (estimated offset) for the NMEA “IP Address”. Here’s a python script to run some numbers for you – just copy + paste the last 100 or so lines from the statistics.log file into a file named ‘chrony_statistics.log’ in the same directory as this python file:
import pandas as pd
import matplotlib.pyplot as plt
from datetime import datetime

def parse_chrony_stats(file_path):
    """
    Parse chrony statistics log file and return a pandas DataFrame
    """
    # read file contents first
    with open(file_path, 'r') as f:
        file_contents = f.readlines()

    # for each line, if it starts with '=' or ' ', skip it
    file_contents = [line for line in file_contents if not line.startswith('=') and not line.startswith(' ')]

    # exclude lines that include 'PPS'
    file_contents = [line for line in file_contents if 'PPS' not in line]

    # Use StringIO to create a file-like object from the filtered contents
    from io import StringIO
    csv_data = StringIO(''.join(file_contents))

    # Read the filtered data using pandas
    df = pd.read_csv(csv_data,
                     delim_whitespace=True,
                     names=['Date', 'Time', 'IP_Address', 'Std_dev', 'Est_offset', 'Offset_sd',
                           'Diff_freq', 'Est_skew', 'Stress', 'Ns', 'Bs', 'Nr', 'Asym'])


    # Combine Date and Time columns into a datetime column
    df['timestamp'] = pd.to_datetime(df['Date'] + ' ' + df['Time'])

    return df

def plot_est_offset(df):
    """
    Create a plot of Est_offset vs time for each IP address
    """
    plt.figure(figsize=(12, 6))

    # Plot each IP address as a separate series
    for ip in df['IP_Address'].unique():
        ip_data = df[df['IP_Address'] == ip]
        plt.plot(ip_data['timestamp'], ip_data['Est_offset'],
                marker='o', label=ip, linestyle='-', markersize=4)

    plt.xlabel('Time')
    plt.ylabel('Estimated Offset (seconds)')
    plt.title('Chrony Estimated Offset Over Time by IP Address')
    plt.legend()
    plt.grid(True)

    # Rotate x-axis labels for better readability
    plt.xticks(rotation=45)

    # Adjust layout to prevent label cutoff
    plt.tight_layout()

    return plt

def analyze_chrony_stats(file_path):
    """
    Main function to analyze chrony statistics
    """
    # Parse the data
    df = parse_chrony_stats(file_path)

    # Create summary statistics
    summary = {
        'IP Addresses': df['IP_Address'].nunique(),
        'Time Range': f"{df['timestamp'].min()} to {df['timestamp'].max()}",
        'Average Est Offset by IP': df.groupby('IP_Address')['Est_offset'].mean().to_dict(),
        'Max Est Offset by IP': df.groupby('IP_Address')['Est_offset'].max().to_dict(),
        'Min Est Offset by IP': df.groupby('IP_Address')['Est_offset'].min().to_dict(),
        'Median Est Offset by IP': df.groupby('IP_Address')['Est_offset'].median().to_dict()
    }

    # Create the plot
    plot = plot_est_offset(df)

    return df, summary, plot

# Example usage
if __name__ == "__main__":
    file_path = "chrony_statistics.log"  # Replace with your file path
    df, summary, plot = analyze_chrony_stats(file_path)

    # Print summary statistics
    print("\nChrony Statistics Summary:")
    print("-" * 30)
    print(f"Number of IP Addresses: {summary['IP Addresses']}")
    print(f"Time Range: {summary['Time Range']}")
    print("\nAverage Estimated Offset by IP:")
    for ip, avg in summary['Average Est Offset by IP'].items():
        print(f"{ip}: {avg:.2e}")

    print("\nMedian Estimated Offset by IP:")
    for ip, median in summary['Median Est Offset by IP'].items():
        print(f"{ip}: {median:.2e}")

    # Show the plot
    plt.show()
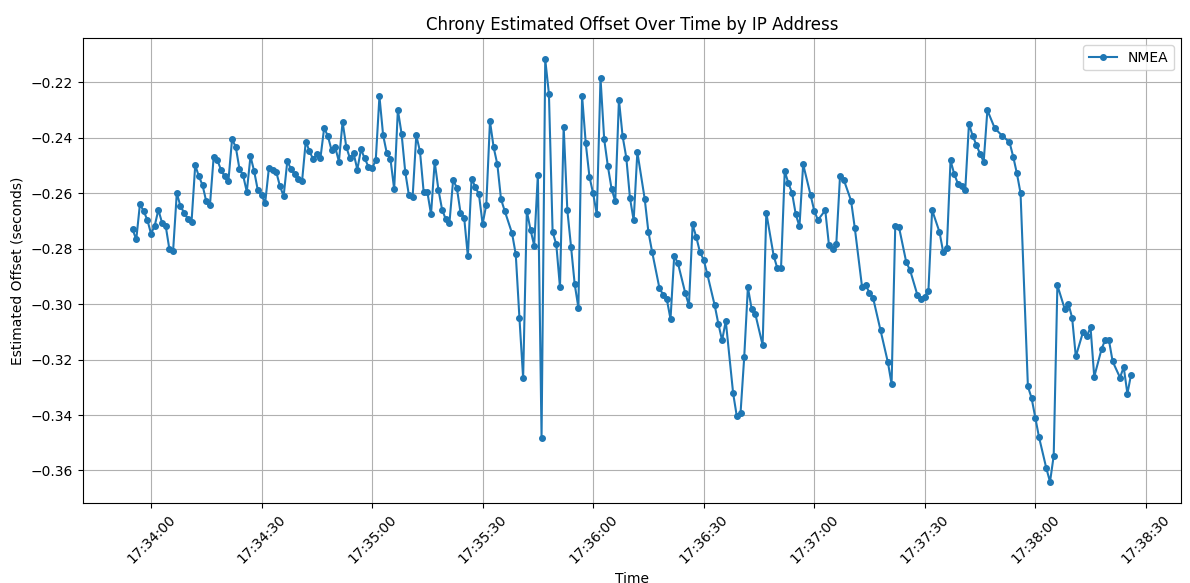
We get a pretty graph (and by pretty, I mean ugly – this is highly variable, with the slow 9600 default bits per second, the timing will actually be influenced by the number of seen/tracked satellites since we haven’t messed with what sentences are outputted) and some outputs.
matplotlib chart for chrony offset for NMEA source running at 9600 bps
And the avg/median offset:
Chrony Statistics Summary:
------------------------------
Number of IP Addresses: 1
Time Range: 2025-02-14 17:33:55 to 2025-02-14 17:38:26

Average Estimated Offset by IP:
NMEA: -2.71e-01

Median Estimated Offset by IP:
NMEA: -2.65e-01
So we need to pick a number here for the offset. They do not differ by much, 271 millseconds vs 265. Let’s just split the difference at 268. Very scientific. With this number, we can change the offset in the chrony config for the NMEA source. Make it positive to offset.
This usually works but I’m not getting good results so please refer to the previous post for how this should look. Turns out with the default sentences, some of the timing was attributed to 900-1000 milliseconds late, meaning the Pi was synchronizing to a full second late than actual. Couple options to resolve: increase baudrate, and reduce/eliminate unnecessary NMEA sentences. I increased the baudrate below, which won’t be necessary for any modules that have a baudrate higher than 9600 for default. If you don’t care about monitoring the GPS status, disable all sentences except for ZDA (time info).
I took an hour or so detour here to figure out how to change the baudrate on the MTK chip used in the Adafruit GPS module.
Long story short on the baudrate change:
austin@raspberrypi5:~ $ cat gps-baud-change.sh
#!/bin/bash

# Stop gpsd service and socket
sudo systemctl stop gpsd.service gpsd.socket

# Set the baud rate
sudo gpsctl -f -x "$PMTK251,38400*27\r\n" /dev/ttyAMA0


# Start gpsd back up
sudo systemctl start gpsd.service
#gpsd -n -s 38400 /dev/ttyAMA0 /dev/pps0

sudo systemctl restart chrony
How to automate this via systemd or whatever is the topic for another post. The GPS module will keep the baudrate setting until it loses power (so it’ll persist through a Pi reboot!).
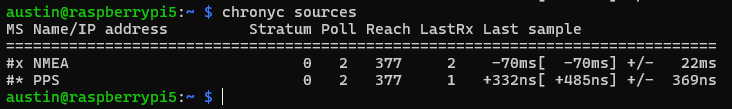
Turns out that the offset needs to be 511 milliseconds for my Pi/Adafruit GPS at 38400 bps:
Now we can check what Chrony is using for sources with
chronyc sources
# or if you want to watch it change as it happens
watch -n 1 chronyc sources
chronyc sources showing a lock on PPS (denoted with *) and false ticker on NMEA (denoted with x), which is the expected and desired status after a couple minutes
Many people asked how to get both time/NMEA and PPS from a single GPS receiver (i.e. without a 3rd source) and this is how. The keys are the lock directive as well as the trust directive on the PPS source.
8 – results
Check what chrony thinks of the system clock with
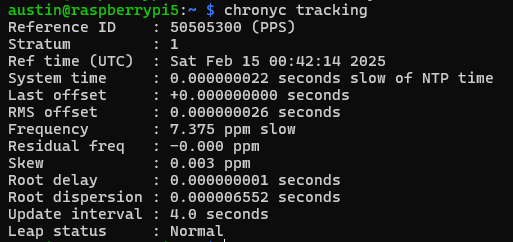
chronyc tracking
Here we see a few key items:
System time – this is updated every second with what Chrony thinks the time vs what the system time is, we are showing 64 nanoseconds
Last offset – how far off the system clock was at last update (from whatever source is selected). I got lucky with this capture, which shows 0 nanoseconds off
RMS offset – a long term average of error. I expect this to get to low double-digit nanoseconds. Decreasing further is the topic of the next post.
Frequency – the drift of the system clock. This number can kind of be whatever, as long as it is stable, but the closer to zero, the better. There is always a temperature correlation with the oscillator temperature vs frequency. This is what chrony is constantly correcting.
Residual frequency – difference from what the frequency is and what it should be (as determined by the selected source)
Skew – error in the frequency – lower is better. Less than 0.05 is very stable.
Root delay/dispersion – basically how far from the “source” of truth your chrony is
Update interval – self explanatory
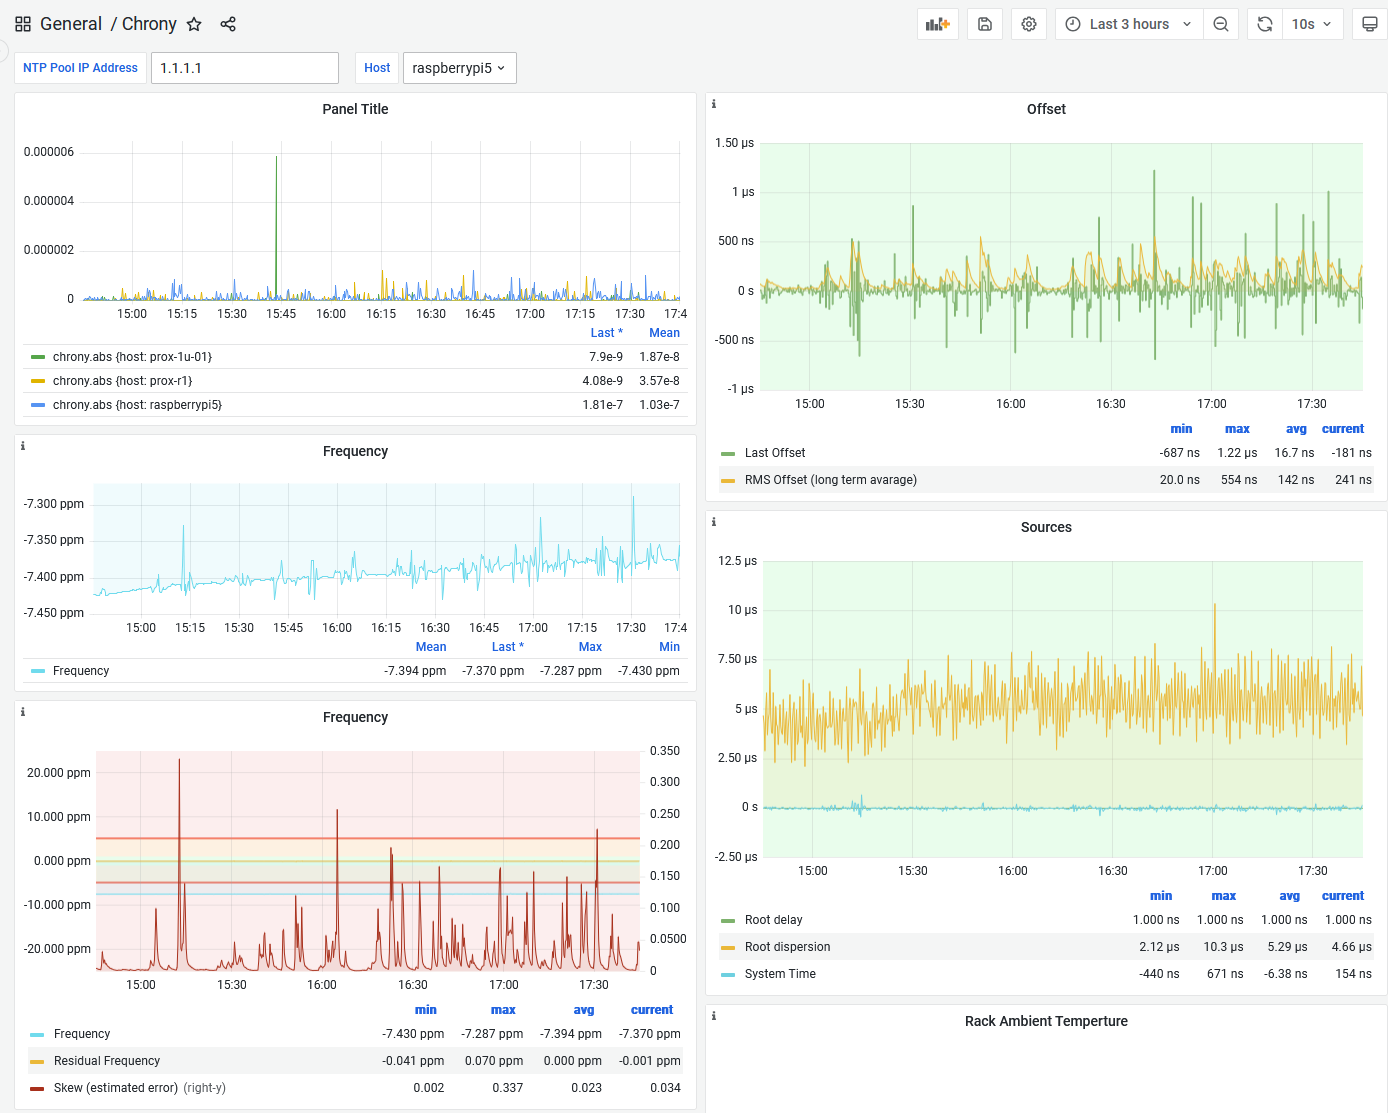
9 – Grafana dashboard showing Chrony stats
And to track the results over time, I feed the Chrony data to InfluxDB via Telegraf. Another topic for a future post. The dashboard looks like this:
Here we can see a gradual increase in the frequency on the Raspberry Pi 5 system clock. The offsets are almost always within 1 microsecond, with average of 16.7 nanoseconds. The spikes in skew correspond to the spikes in offsets. Something is happening on the Pi to probably spike CPU loading (even though I have the CPU throttled to powersave mode), which speeds things up and affects the timing via either powerstate transitions or oscillator temperature changes or both.
Conclusion
In 2025, a GPS sending PPS to Raspberry Pi is still a great way to get super accurate time. In this Chrony config, I showed how to get time of day, as well as precision seconds without an external source. Our offsets are well under one microsecond.
In the next post, we will examine how to maximize the performance (by minimizing the frequency skew!) of our Raspberry Pi/PPS combination.
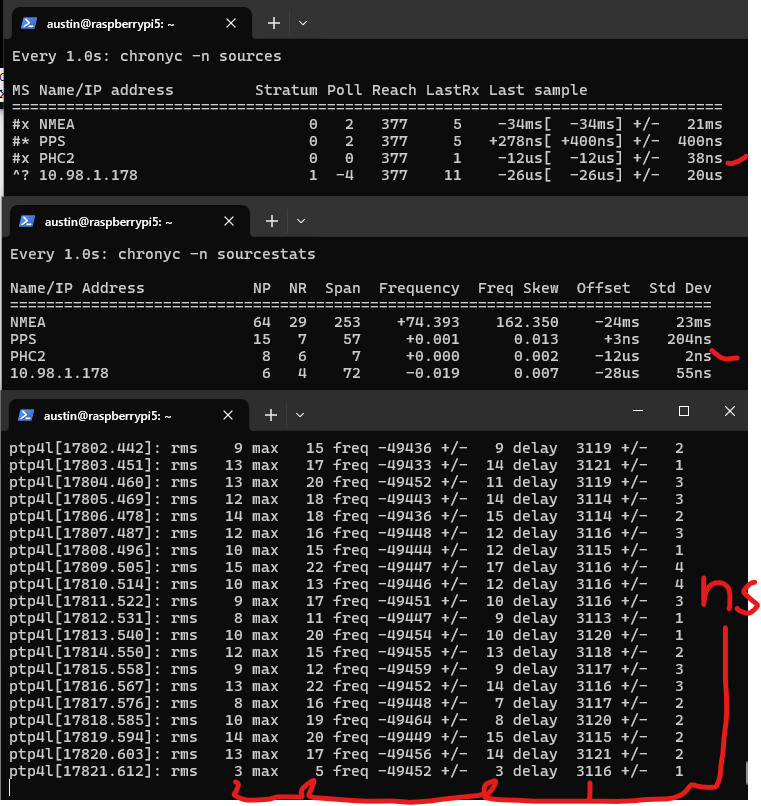
And for the post after that – here’s a preview of using PTP from an Oscilloquartz OSA 5401 SyncPlug. Note the standard deviations and offsets. This device has a OCXO – oven controlled crystal oscillator – that has frequency stability measured in ppb (parts per billion). It also has a NEO-M8T timing chip, the same one I mentioned in the beginning of this post.
screenshot showing three terminals up – 1) chrony sources, with a PHC (physical hardware clock) in the NIC. error is shown as +/- 38 nanoseconds. 2) chrony source stats, showing a standard deviation of 2 nanoseconds for that same source and 3) linuxptp synchronizing the PHC from the OSA 5401 SyncPlug with all numbers shown in nanoseconds. rms is error of the PHC from the SyncPlug, max is max offset, freq is pretty bad for this oscillator at -49xxx PPM, delay is ethernet delay (3.1 microseconds)
The OSA 5401 SyncPlug is quite difficult to come by (I scored mine for $20 – shoutout to the servethehome.com forums! this device likely had a list price in the thousands) so I’ll also show how to just set up a PTP grandmaster (that’s the official term) on your Raspberry Pi.
Next Steps
Document commands to set ublox module to 16 Hz timepulses
Document commands to set ublox to survey-in upon power on
Document commands to set ublox to use GPS + Beidou + Galileo
Document Chrony config to use 16 Hz timepulses
Configure Pi to use performance CPU governor to eliminate CPU state switch latency
Telegraf/InfluxDB/Grafana configuration for monitoring
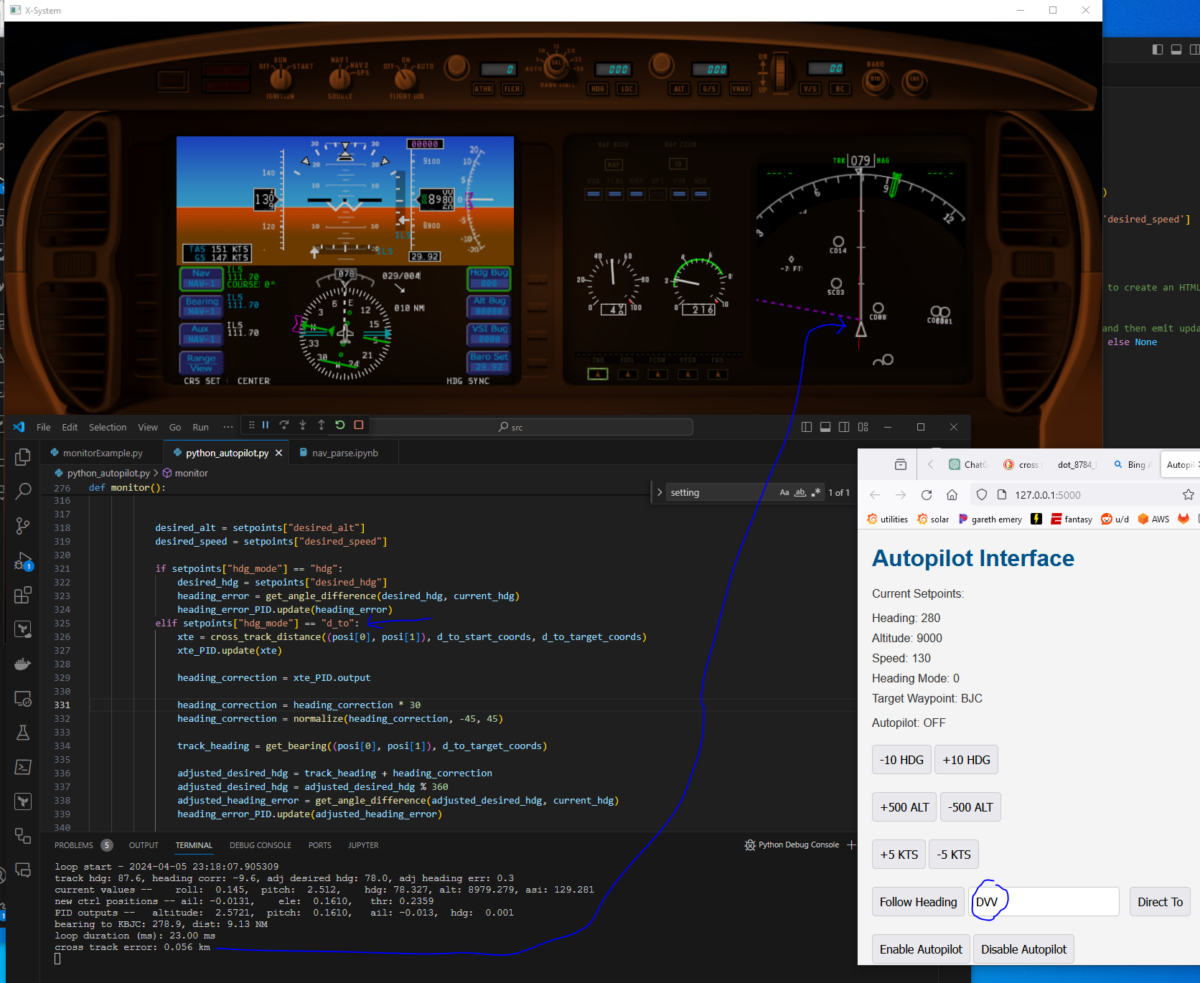
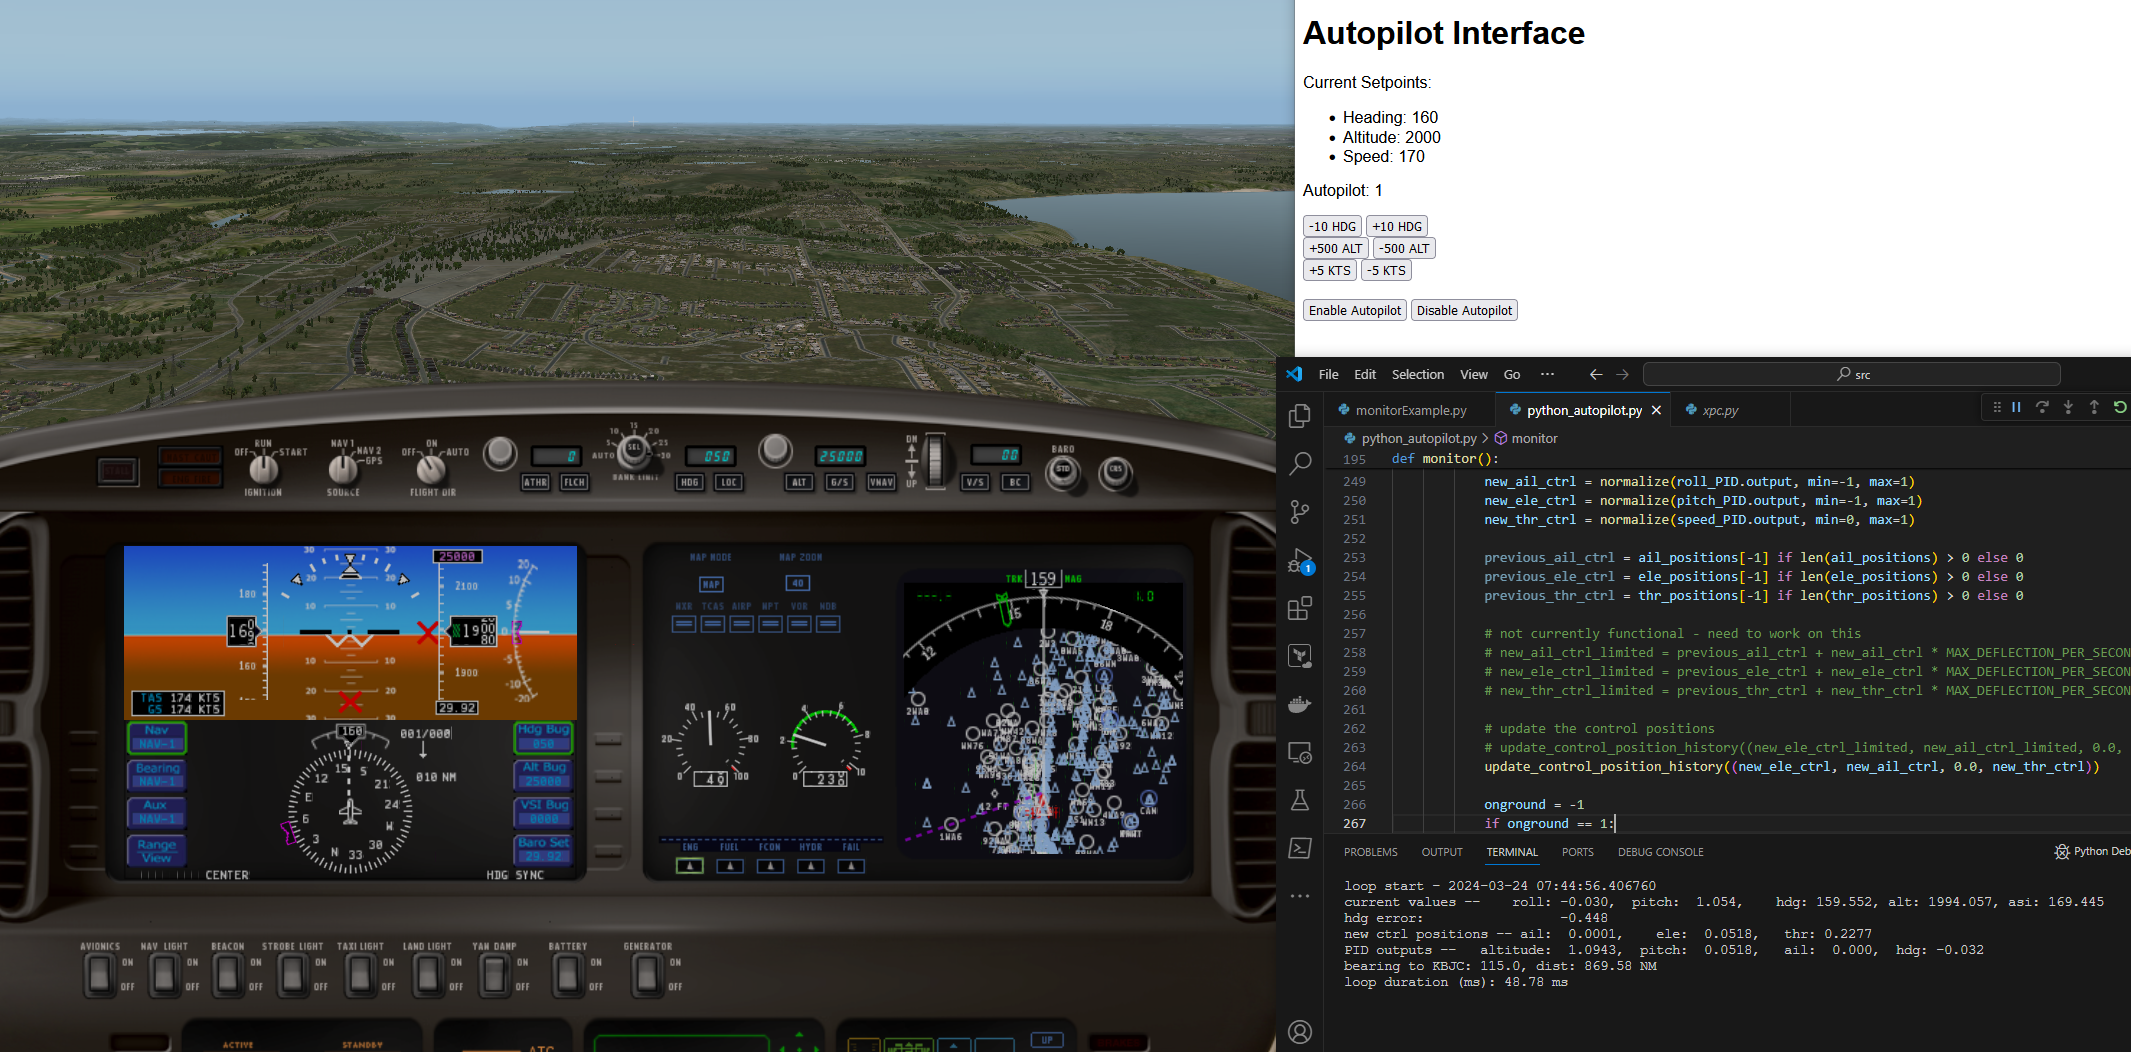
screenshot showing python autopilot code controlling xplane, flying aircraft along a track
Continuing from the last post (Adding some polish to the X-Plane Python Autopilot with Flask, Redis, and WebSockets), I have a bit of momentum going on the Python X-Plane Autopilot stuff. There were a couple of items I wanted to complete before declaring the project “done”. The first is a “takeoff” button, which isn’t yet done. The other is the ability to fly along a track. That is now complete as of last night.
It is one thing to fly a bearing from A to B. That works fine as long as there is no wind in any direction. Flying a heading set by bearing is easy, and is part of the heading select & hold feature built out in a previous iteration of the code. To do so requires a “desired heading” and a heading error PID. The goal is to minimize the heading error, so we set the setpoint to 0. This controls a “roll” PID controller, which controls an aileron PID controller.
Each have limits in place to prevent excessive movement. For example, the roll PID controller is limited to +/- 30 degrees. Pitch is +/- 15 degrees.
To take this to the next step requires a few things:
A “track”, which is commonly defined as a start point and an end point. Both are simply lat/lon coordinate sets.
A current location, which is current lat/lon
A cross track distance (error), which is the distance the current location is off the track.
More PID loops, namely a cross track distance PID control, which, like the heading error PID, has a setpoint of 0 (i.e. the goal is to minimize the cross track distance).
Additionally, to make something actually useful, we need a “database” of navigation points. I parsed the fixed-width delimited text files of X-Plane for this, which was not fun.
To tie it all together, the web interface needs a way to type in a nav point, and a Direct To (D->To) button. Direct to is common in aviation GPS units to set a track from the location when the button is pushed to some point (VOR, fix, airport, etc). I’ve emulated that functionality.
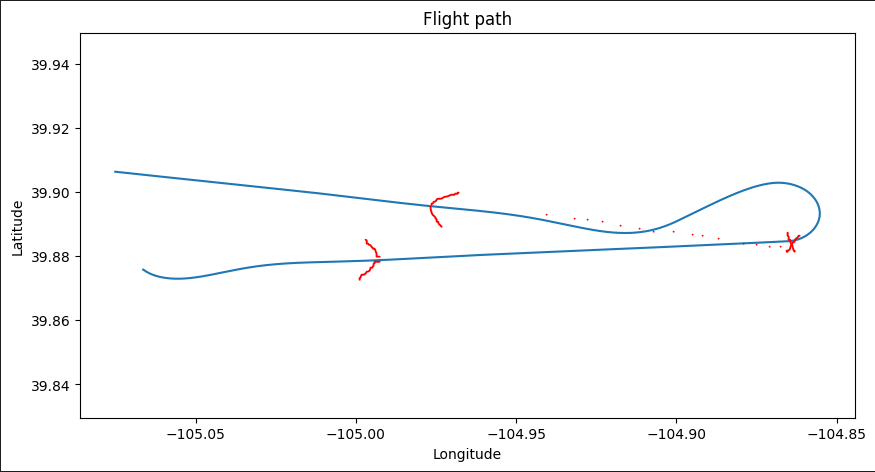
Here’s the screenshot showing the example aircraft navigating to DVV, which is the KDEN VOR, from somewhere near KBJC. It shows a cross track error of 0.056 km, or 56 meters. ChatGPT helpfully generated the cross track error function with a resultant number in meters. I am comfortable with many kinds of units so I’ll leave this for now. The red line on the right map view is the aircraft’s interpretation of the direct to set at the same time as I clicked my autopilot’s Direct To button. There is a 4 kt wind coming from 029. I tested with greater, somewhat constant crosswinds in the 40-50 kt range with gusts of +/- 5 kts.
The cross track error settles down to < 10 m after a minute or so. It is a little “lazy”. If it is on a track that is due east, and I flip the track to due west, it’ll dutifully do the 180, then attempt to rejoin the track but it overshoots a bit and settles down after ~1 oscillation. I could probably turn up the P on the xte PID and that would help. Below is a track of tacking off from KBJC and the doing direct to DVV. The X is where I clicked Direct to back to the BJC VOR, it turned left and rejoined the track, overshooting, then settling back in nicely.
The Python Autopilot Code
I’m not going to pretend I wrote the cross track distance code, nor will I pretend to understand it. It works. The sign of the result depends on something along the lines of which side of the great circle line you are on. Luckily, aircraft (and boats and other things that follow tracks) don’t typically go from B to A. They go from A to B so this is consistent no matter which direction the track is facing. If they do need to go back to the start, the start becomes the end, if that makes sense.
This is the glorious cross track distance code along with some test code. Using Google Earth, the distance from the KBJC control tower to the centerline of 30R/12L should be ~0.44 km.
def cross_track_distance(point, start, end):
    # Convert all latitudes and longitudes from degrees to radians
    point_lat, point_lon = math.radians(point[0]), math.radians(point[1])
    start_lat, start_lon = math.radians(start[0]), math.radians(start[1])
    end_lat, end_lon = math.radians(end[0]), math.radians(end[1])

    # Calculate the angular distance from start to point
    # Ensure the argument is within the domain of acos
    acos_argument = math.sin(start_lat) * math.sin(point_lat) + math.cos(start_lat) * math.cos(point_lat) * math.cos(point_lon - start_lon)
    acos_argument = max(-1, min(1, acos_argument))  # Clamp the argument between -1 and 1
    delta_sigma = math.acos(acos_argument)

    # Calculate the bearing from start to point and start to end
    theta_point = math.atan2(math.sin(point_lon - start_lon) * math.cos(point_lat),
                             math.cos(start_lat) * math.sin(point_lat) - math.sin(start_lat) * math.cos(point_lat) * math.cos(point_lon - start_lon))
    theta_end = math.atan2(math.sin(end_lon - start_lon) * math.cos(end_lat),
                           math.cos(start_lat) * math.sin(end_lat) - math.sin(start_lat) * math.cos(end_lat) * math.cos(end_lon - start_lon))

    # Calculate the cross track distance
    cross_track_dist = math.asin(math.sin(delta_sigma) * math.sin(theta_point - theta_end))

    # Convert cross track distance to kilometers by multiplying by the Earth's radius (6371 km)
    cross_track_dist = cross_track_dist * 6371

    return cross_track_dist

kbjc_runways = {
	"30R/12L": {
		"Runway 12L": {
			"Latitude": 39.91529286666667,
			"Longitude": -105.12841313333334
		},
		"Runway 30R": {
			"Latitude": 39.901373883333335,
			"Longitude": -105.10191808333333
		}
	}
}


kbjc_runway_30R_start = (kbjc_runways["30R/12L"]["Runway 30R"]["Latitude"], kbjc_runways["30R/12L"]["Runway 30R"]["Longitude"])
kbjc_runway_30R_end = (kbjc_runways["30R/12L"]["Runway 12L"]["Latitude"], kbjc_runways["30R/12L"]["Runway 12L"]["Longitude"])
kbjc_tower = (test_locations["kbjc_tower"]["lat"], test_locations["kbjc_tower"]["lon"])
def test_cross_track_distance():
	print(f"start lat: {kbjc_runway_30R_start[0]}, start lon: {kbjc_runway_30R_start[1]}")
	print(f"end lat: {kbjc_runway_30R_end[0]}, end lon: {kbjc_runway_30R_end[1]}")
	print(f"tower lat: {kbjc_tower[0]}, tower lon: {kbjc_tower[1]}")

	dist = cross_track_distance(kbjc_tower, kbjc_runway_30R_start, kbjc_runway_30R_end)
	print(f"cross track distance: {dist}")

test_cross_track_distance()
And the rest of the magic happens in this block. If you recall from the last post (Adding some polish to the X-Plane Python Autopilot with Flask, Redis, and WebSockets), I am using Redis as a store to hold the setpoints from the web app controlling the autopilot. It is fast enough that I don’t need to worry about latency when running at 10 Hz (the loop durations are consistently less than 30 milliseconds, with the bulk of that time being used to get and set data from X-Plane itself).
# get the setpoints from redis
			setpoints = get_setpoints_from_redis()

			# check if we have just changed to direct-to mode and if so, update the direct to coords. same if the target waypoint has changed
			if (setpoints["hdg_mode"] == "d_to" and previous_nav_mode != "d_to") or (setpoints["target_wpt"] != previous_nav_target):
				print("reason for entering this block")
				print(f"previous nav mode: {previous_nav_mode}, setpoints hdg mode: {setpoints['hdg_mode']}, previous nav target: {previous_nav_target}, setpoints target wpt: {setpoints['target_wpt']}")

				# d_to_start_coords is the current position, in lat,lon tuple
				d_to_start_coords = (posi[0], posi[1])

				# this function does a lookup in the nav_points dataframe to get the lat, lon of the target waypoint
				# it could certainly be optimized to use something faster than a pandas dataframe
				d_to_target_coords = get_nav_point_lat_lon(setpoints["target_wpt"])

				# reset xte PID
				xte_PID.clear()
				print(f"setting d_to_start_coords to {d_to_start_coords}")

			# these are unchanged
			desired_alt = setpoints["desired_alt"]
			desired_speed = setpoints["desired_speed"]

			if setpoints["hdg_mode"] == "hdg":
				# if we're in heading mode, just use the desired heading. this is mostly unchanged from the previous iteration
				desired_hdg = setpoints["desired_hdg"]
				heading_error = get_angle_difference(desired_hdg, current_hdg)
				heading_error_PID.update(heading_error)

			elif setpoints["hdg_mode"] == "d_to":
				# if we're in direct-to mode, calculate the cross-track error and update the xte_PID.
				# I am using xte to mean cross-track error/distance
				xte = cross_track_distance((posi[0], posi[1]), d_to_start_coords, d_to_target_coords)
				xte_PID.update(xte)

				# calculate the heading correction based on the xte_PID output
				heading_correction = xte_PID.output

				# this is essentially saying for 1 km of cross-track error, we want to correct by 30 degrees
				heading_correction = heading_correction * 30

				# limit the heading correction to -45 to 45 degrees
				heading_correction = normalize(heading_correction, -45, 45)

				# calculate the track heading to the target waypoint. the track heading is the heading we would
				# need to fly to get to the target waypoint from the current position. it is used as an initial heading
				track_heading = get_bearing((posi[0], posi[1]), d_to_target_coords)

				# adjust the desired heading by the heading correction
				adjusted_desired_hdg = track_heading + heading_correction

				# make sure the adjusted desired heading is between 0 and 360
				adjusted_desired_hdg = adjusted_desired_hdg % 360

				# calculate the heading error based on the adjusted desired heading, this is no different than the hdg mode
				adjusted_heading_error = get_angle_difference(adjusted_desired_hdg, current_hdg)
				heading_error_PID.update(adjusted_heading_error)

				# log the current values
				print(f"track hdg: {track_heading:.1f}, heading corr: {heading_correction:.1f}, adj desired hdg: {adjusted_desired_hdg:.1f}, adj heading err: {adjusted_heading_error:.1f}")

				# write to a log file so we can make nice plots for the blog post
				log_line = f"{datetime.now().strftime('%Y-%m-%d %H:%M:%S.%f')[:-3]},{posi[0]},{posi[1]},{posi[2]},{xte},{xte_PID.output},{track_heading},{heading_correction},{adjusted_desired_hdg},{adjusted_heading_error}"
				with open(current_run_log_filename, "a") as log_file:
					log_file.write(log_line + "\n")
Getting nav data from X-Plane data files
If you looked at the code closely, you will see the d_to_target_coords is set via a function called get_nav_point_lat_lon(nav_point). This looks up lat/lon in a file that was generated by parsing the X-Plane navigation data. In my previous job, I dealt with fixed width data formats. It is not fun. I originally tried to split based on spaces, but some of the nav point names have more than one space in them. I suppose I could just ignore the name but this is already written. This code parses the earth_nav.dat file, specifically for type 3, which is VOR/DME-like.
import pandas as pd

nav_filepath = r"C:\Users\Austin\Desktop\X-Plane 10\Resources\default data\earth_nav.dat"

raw_file_data = open(nav_filepath, 'r').readlines()

# remove first 3 lines
raw_file_data = raw_file_data[3:]

# remove last line
raw_file_data = raw_file_data[:-1]

# remove new line characters
raw_file_data = [line.replace('\n', '') for line in raw_file_data]

# Adjusting the function based on the new column map provided
def parse_nav_info(line):
    column_map = {
        'type': {'start': 0, 'end': 1},
        'lat_sign': {'start': 2, 'end': 3},
        'latitude': {'start': 3, 'end': 15},
        'lon_sign': {'start': 15, 'end': 16},
        'longitude': {'start': 16, 'end': 28},
        'elevation': {'start': 29, 'end': 35},
        'frequency': {'start': 36, 'end': 41},
        'range': {'start': 42, 'end': 45},
        'unknown': {'start': 46, 'end': 52},
        'identifier': {'start': 53, 'end': 56},
        'name': {'start': 56}  # Assuming end is not needed; take till the end of the line
    }

    nav_info = {}
    for column, column_info in column_map.items():
        start = column_info['start']
        end = column_info.get('end', None)
        value = line[start:end].strip()
        # print(f"attempting to parse {column} with value {value}")
        if column == 'latitude':
            lat_sign = line[column_map['lat_sign']['start']:column_map['lat_sign']['end']]
            lat_sign = -1 if lat_sign == '-' else 1
            value = lat_sign * float(value)
        elif column == 'longitude':
            lon_sign = line[column_map['lon_sign']['start']:column_map['lon_sign']['end']]
            lon_sign = -1 if lon_sign == '-' else 1
            value = lon_sign * float(value)
        elif column == 'elevation':
            value = int(value)
        elif column == 'frequency':
            value = int(value)
        elif column == 'range':
            value = int(value)
        nav_info[column] = value

    return nav_info

i = 0
data = []
types = []
for line in raw_file_data:
    line_type = int(line[0:2])
    if line_type != 3:
        continue

    line_data = parse_nav_info(line)
    data.append(line_data)

df = pd.DataFrame(data)
columns_of_interest = ['identifier','latitude','longitude','elevation', 'frequency', 'range', 'name']
df = df[columns_of_interest]
df.head()

df.to_pickle('nav_data.pkl')
The code to read the file and import is at the beginning of the python_autopilot.py file and is fairly straightforward:
# nav_data.pkl is a pandas dataframe. yes, this should use a dict or something faster.
nav_points = pickle.load(open("nav_data.pkl", "rb"))

def get_nav_point_lat_lon(id):
	nav_point = nav_points[nav_points["identifier"] == id]
	return nav_point["latitude"].values[0], nav_point["longitude"].values[0]
And for the Flask side of the house, we have index.html:
<!DOCTYPE html>
<html>
<head>
    <title>Autopilot Interface</title>
    <script src="https://cdnjs.cloudflare.com/ajax/libs/socket.io/4.0.1/socket.io.js"></script>
<script type="text/javascript" charset="utf-8">
    var socket;  // Declare socket globally

    // Define adjustSetpoint globally
    function adjustSetpoint(label, adjustment) {
        socket.emit('adjust_setpoint', {label: label, adjustment: adjustment});
    }

    function submitDirectTo() {
        const stationId = document.getElementById('target_wpt_input').value; // Grab the value from the input
        if (stationId) { // Check if the stationId is not empty
            adjustSetpoint('target_wpt', stationId); // Adjust the setpoint with the stationId as the value
            adjustSetpoint('hdg_mode', "d_to"); // Your existing function call
        } else {
            alert("Please enter a station ID.");
        }
    }

    document.addEventListener('DOMContentLoaded', () => {
        socket = io.connect(location.protocol + '//' + document.domain + ':' + location.port);

        socket.on('connect', () => {
            console.log("Connected to WebSocket server.");
        });

        // Listen for update_setpoints event to initialize the UI with Redis values
        socket.on('update_setpoints', function(setpoints) {
          for (const [label, value] of Object.entries(setpoints)) {
              const element = document.getElementById(label);
              if (element) {
                  element.innerHTML = value;
              }
          }
      });

        // Listen for update_setpoint events from the server
        socket.on('update_setpoint', data => {
            // Assuming 'data' is an object like {label: new_value}
            for (const [label, value] of Object.entries(data)) {
                // Update the displayed value on the webpage
                const element = document.getElementById(label);
                if (element) {
                    element.innerHTML = value;
                }
            }
        });
    });
</script>
<style>
    body {
        font-family: Arial, sans-serif;
        margin: 20px;
        background-color: #f4f4f4;
        color: #333;
    }
    h1 {
        color: #005288;
    }
    ul {
        list-style-type: none;
        padding: 0;
    }
    ul li {
        margin: 10px 0;
    }
    button, input[type="text"] {
        padding: 10px;
        margin-top: 5px;
        border: 1px solid #ccc;
        border-radius: 5px;
        cursor: pointer;
        font-size: 16px;
    }
    button:hover {
        background-color: #ddd;
    }
    .button-group {
        margin-bottom: 20px;
    }
    #target_wpt_input {
        margin-right: 10px;
    }
</style>

</head>
<body>
    <h1>Autopilot Interface</h1>
    <p>Current Setpoints:</p>
    <ul>
        <li>Heading: <span id="desired_hdg">0</span></li>
        <li>Altitude: <span id="desired_alt">0</span></li>
        <li>Speed: <span id="desired_speed">0</span></li>
        <li>Heading Mode: <span id="hdg_mode">0</span></li>
        <li>Target Waypoint: <span id="target_wpt">BJC</span></li>
    </ul>
    <p>Autopilot: <span id="autopilot_enabled">OFF</span></p>

    <!-- Example buttons for adjusting setpoints -->
    <div class="button-group">
        <button onclick="adjustSetpoint('desired_hdg', -10)">-10 HDG</button>
        <button onclick="adjustSetpoint('desired_hdg', 10)">+10 HDG</button>
    </div>
    <div class="button-group">
        <button onclick="adjustSetpoint('desired_alt', 500)">+500 ALT</button>
        <button onclick="adjustSetpoint('desired_alt', -500)">-500 ALT</button>
    </div>
    <div class="button-group">
        <button onclick="adjustSetpoint('desired_speed', 5)">+5 KTS</button>
        <button onclick="adjustSetpoint('desired_speed', -5)">-5 KTS</button>
    </div>
    <div class="button-group">
        <button onclick="adjustSetpoint('hdg_mode', 'hdg')">Follow Heading</button>
        <input type="text" id="target_wpt_input" value="BJC">
        <button onclick="submitDirectTo()">Direct To</button>
    </div>
    <div class="button-group">
        <button onclick="adjustSetpoint('autopilot_enabled', 1)">Enable Autopilot</button>
        <button onclick="adjustSetpoint('autopilot_enabled', 0)">Disable Autopilot</button>
    </div>

</body>
</html>
And the Flask app itself. I still think WebSockets are magic.
from flask import Flask, render_template
from flask_socketio import SocketIO, emit
import redis

app = Flask(__name__)
socketio = SocketIO(app)
r = redis.StrictRedis(host='localhost', port=6379, db=0)

setpoints_of_interest = ['desired_hdg', 'desired_alt', 'desired_speed']
# get initial setpoints from Redis, send to clients

@app.route('/')
def index():
    return render_template('index.html')  # You'll need to create an HTML template

def update_setpoint(label, adjustment):
    # This function can be adapted to update setpoints and then emit updates via WebSocket
    current_raw_value = r.get(label) if r.exists(label) else None
    if current_raw_value is not None:
        try:
            current_value = float(current_raw_value)
        except ValueError:
            current_value = current_raw_value

    if label == 'desired_hdg':
        new_value = (current_value + adjustment) % 360
    elif label == 'autopilot_enabled':
        new_value = adjustment
    elif label == 'hdg_mode':
        new_value = adjustment
    elif label == 'target_wpt':
        new_value = adjustment
    else:
        new_value = current_value + adjustment

    r.set(label, new_value)
    # socketio.emit('update_setpoint', {label: new_value})  # Emit update to clients
    return new_value

@socketio.on('adjust_setpoint')
def handle_adjust_setpoint(json):
    label = json['label']
    adjustment = json['adjustment']
    # Your logic to adjust the setpoint in Redis and calculate new_value
    new_value = update_setpoint(label, adjustment)

    # Emit updated setpoint to all clients
    emit('update_setpoint', {label: new_value}, broadcast=True)

@socketio.on('connect')
def handle_connect():
    # Fetch initial setpoints from Redis
    initial_setpoints = {label: float(r.get(label)) if r.exists(label) else 0.0 for label in setpoints_of_interest}

    # Emit the initial setpoints to the connected client
    emit('update_setpoints', initial_setpoints)

if __name__ == '__main__':
    socketio.run(app)
And here’s the full code of the autopilot itself. This will be transferred to GitHub for the next post. It is a bit long and needs to be split out into a number of separate files.
With a cross track distance known, it isn’t terribly difficult to convert that distance (error) into a heading adjustment. We now have a functioning autopilot that can control our aircraft to any VOR-like point. I could extend the X-Plane nav data parsing to read all points, but I’ll leave that as an exercise for the reader. The X-Plane Python Autopilot is almost complete – all that I have left on the checklist is a “takeoff” button. Hope you enjoyed the post!
I revisited my Python X-Plane autopilot a few weeks ago because it was pretty clunky for how to adjust setpoints and such. The job I started 1.5 years ago is exclusively Python, so I wanted to redo a bit.
Quick aside: For the new PC I just built – Ryzen 9 7900x, 2x32GB 6000 MHz, etc, X-Plane 10 was the 2nd “game” I installed on it. The first was Factorio (I followed Nilaus’ megabase in a book and have got to 5k SPM). Haven’t tried the newer sims yet, but I think they’ll still be somewhat limited by my RTX 2080 Super.
Well imagine my surprise when I woke up to 6x the normal daily hits by 7am. I checked the weblogs and found that my post was trending on ycombinator.com (Hacker News). So I am going to skip pretty much all background and just post the updated code for now, and will go back and clean up this post at some point.
Without further ado: here’s what the super basic dashboard looks like
I have it separated into two main running python programs, the file that interacts with X-Plane itself, and the Flask part.
Here’s the adjusted autopilot code to check with Redis for the setpoints every loop execution:
# https://onion.io/2bt-pid-control-python/
# https://github.com/ivmech/ivPID

import sys
import os
import xpc
from datetime import datetime, timedelta
import PID
import time
import math, numpy
import redis

r = redis.StrictRedis(host='localhost', port=6379, db=0)

setpoints = {
	"desired_roll": 0,
	"desired_pitch": 2,
	"desired_speed": 160,
	"desired_alt": 8000.0,
	"desired_hdg": 140,
	"autopilot_enabled": 0
}

for key in setpoints:
	# if the key exists in the redis db, use it
	# otherwise, set it
	if r.exists(key):
		setpoints[key] = float(r.get(key))
	else:
		r.set(key, setpoints[key])

update_interval = 0.10 #seconds
update_frequency = 1/update_interval

P = 0.05
I = 0.01
D = 0
MAX_DEFLECTION_PER_SECOND = 2.0

roll_PID = PID.PID(P*2, I*2, D)
roll_PID.SetPoint = setpoints["desired_roll"]

pitch_PID = PID.PID(P, I, D)
pitch_PID.SetPoint = setpoints["desired_pitch"]

altitude_PID = PID.PID(P*2, P/2, D)
altitude_PID.SetPoint = setpoints["desired_alt"]

speed_PID = PID.PID(P, I, D)
speed_PID.SetPoint = setpoints["desired_speed"]

heading_error_PID = PID.PID(1,0.05,0.1)
heading_error_PID.SetPoint = 0 # need heading error to be 0

DREFs = ["sim/cockpit2/gauges/indicators/airspeed_kts_pilot",
		"sim/cockpit2/gauges/indicators/heading_electric_deg_mag_pilot",
		"sim/flightmodel/failures/onground_any",
		"sim/flightmodel/misc/h_ind"]

def normalize(value, min=-1, max=1):
	if (value > max):
		return max
	elif (value < min):
		return min
	else:
		return value

def sleep_until_next_tick(update_frequency):
    # Calculate the update interval from the frequency
    update_interval = 1.0 / update_frequency

    # Get the current time
    current_time = time.time()

    # Calculate the time remaining until the next tick
    sleep_time = update_interval - (current_time % update_interval)

    # Sleep for the remaining time
    time.sleep(sleep_time)

# https://rosettacode.org/wiki/Angle_difference_between_two_bearings#Python
def get_angle_difference(b1, b2):
	r = (b2 - b1) % 360.0
	# Python modulus has same sign as divisor, which is positive here,
	# so no need to consider negative case
	if r >= 180.0:
		r -= 360.0
	return r

# https://gist.github.com/jeromer/2005586
def get_bearing(pointA, pointB):
    """
    Calculates the bearing between two points.
    The formulae used is the following:
        θ = atan2(sin(Δlong).cos(lat2),
                  cos(lat1).sin(lat2) − sin(lat1).cos(lat2).cos(Δlong))
    :Parameters:
      - `pointA: The tuple representing the latitude/longitude for the
        first point. Latitude and longitude must be in decimal degrees
      - `pointB: The tuple representing the latitude/longitude for the
        second point. Latitude and longitude must be in decimal degrees
    :Returns:
      The bearing in degrees
    :Returns Type:
      float
    """
    if (type(pointA) != tuple) or (type(pointB) != tuple):
        raise TypeError("Only tuples are supported as arguments")

    lat1 = math.radians(pointA[0])
    lat2 = math.radians(pointB[0])

    diffLong = math.radians(pointB[1] - pointA[1])

    x = math.sin(diffLong) * math.cos(lat2)
    y = math.cos(lat1) * math.sin(lat2) - (math.sin(lat1)
            * math.cos(lat2) * math.cos(diffLong))

    initial_bearing = math.atan2(x, y)

    # Now we have the initial bearing but math.atan2 return values
    # from -180° to + 180° which is not what we want for a compass bearing
    # The solution is to normalize the initial bearing as shown below
    initial_bearing = math.degrees(initial_bearing)
    compass_bearing = (initial_bearing + 360) % 360

    return compass_bearing

# https://janakiev.com/blog/gps-points-distance-python/
def haversine(coord1, coord2):
    R = 6372800  # Earth radius in meters
    lat1, lon1 = coord1
    lat2, lon2 = coord2

    phi1, phi2 = math.radians(lat1), math.radians(lat2)
    dphi       = math.radians(lat2 - lat1)
    dlambda    = math.radians(lon2 - lon1)

    a = math.sin(dphi/2)**2 + \
        math.cos(phi1)*math.cos(phi2)*math.sin(dlambda/2)**2

    return 2*R*math.atan2(math.sqrt(a), math.sqrt(1 - a))

KBJC_lat = 39.9088056
KBJC_lon = -105.1171944

def write_position_to_redis(position):
	# position is a list of 7 floats
	# position_elements = [lat, lon, alt, pitch, roll, yaw, gear_indicator]
	position_elements = ["lat", "lon", "alt", "pitch", "roll", "yaw", "gear_indicator"]
	position_str = ','.join([str(x) for x in position])
	r.set('position', position_str)
	for i in range(len(position_elements)):
		r.set(f"position/{position_elements[i]}", position[i])

	# position_str = ','.join([str(x) for x in position])
	# r.publish('position_updates', position_str)

def get_setpoints_from_redis():
	setpoints = {
		"desired_roll": 0,
		"desired_pitch": 2,
		"desired_speed": 160,
		"desired_alt": 8000.0,
		"desired_hdg": 140
	}
	for key in setpoints:
		# if the key exists in the redis db, use it
		# otherwise, set it
		if r.exists(key):
			setpoints[key] = float(r.get(key))
		else:
			r.set(key, setpoints[key])
	return setpoints

def get_autopilot_enabled_from_redis():
	if r.exists("autopilot_enabled"):
		return int(r.get("autopilot_enabled").decode('utf-8')) == 1

ele_positions = []
ail_positions = []
thr_positions = []

def update_control_position_history(ctrl):
	ele_positions.append(ctrl[0])
	ail_positions.append(ctrl[1])
	thr_positions.append(ctrl[3])

	# if the list is longer than 20, pop the first element
	if len(ele_positions) > 20:
		ele_positions.pop(0)
		ail_positions.pop(0)
		thr_positions.pop(0)

def monitor():
	with xpc.XPlaneConnect() as client:
		while True:
			loop_start = datetime.now()
			print(f"loop start - {loop_start}")
			posi = client.getPOSI()
			write_position_to_redis(posi)

			ctrl = client.getCTRL()

			bearing_to_kbjc = get_bearing((posi[0], posi[1]), (KBJC_lat, KBJC_lon))
			dist_to_kbjc = haversine((posi[0], posi[1]), (KBJC_lat, KBJC_lon))
			#desired_hdg = 116 #bearing_to_kbjc

			multi_DREFs = client.getDREFs(DREFs) #speed=0, mag hdg=1, onground=2

			current_roll = posi[4]
			current_pitch = posi[3]
			#current_hdg = posi[5] # this is true, need to use DREF to get mag ''
			current_hdg = multi_DREFs[1][0]
			current_altitude = multi_DREFs[3][0]
			current_asi = multi_DREFs[0][0]
			onground = multi_DREFs[2][0]

			# get the setpoints from redis
			setpoints = get_setpoints_from_redis()
			desired_hdg = setpoints["desired_hdg"]
			desired_alt = setpoints["desired_alt"]
			desired_speed = setpoints["desired_speed"]

			# outer loops first
			altitude_PID.SetPoint = desired_alt
			altitude_PID.update(current_altitude)

			heading_error = get_angle_difference(desired_hdg, current_hdg)
			heading_error_PID.update(heading_error)

			speed_PID.SetPoint = desired_speed


			new_pitch_from_altitude = normalize(altitude_PID.output, -10, 10)
			new_roll_from_heading_error = normalize(heading_error_PID.output, -25, 25)
			# if new_pitch_from_altitude > 15:
			# 	new_pitch_from_altitude = 15
			# elif new_pitch_from_altitude < -15:
			# 	new_pitch_from_altitude = -15

			pitch_PID.SetPoint = new_pitch_from_altitude
			roll_PID.SetPoint = new_roll_from_heading_error

			roll_PID.update(current_roll)
			speed_PID.update(current_asi)
			pitch_PID.update(current_pitch)

			new_ail_ctrl = normalize(roll_PID.output, min=-1, max=1)
			new_ele_ctrl = normalize(pitch_PID.output, min=-1, max=1)
			new_thr_ctrl = normalize(speed_PID.output, min=0, max=1)

			previous_ail_ctrl = ail_positions[-1] if len(ail_positions) > 0 else 0
			previous_ele_ctrl = ele_positions[-1] if len(ele_positions) > 0 else 0
			previous_thr_ctrl = thr_positions[-1] if len(thr_positions) > 0 else 0

			# not currently functional - need to work on this
			# new_ail_ctrl_limited = previous_ail_ctrl + new_ail_ctrl * MAX_DEFLECTION_PER_SECOND / update_frequency
			# new_ele_ctrl_limited = previous_ele_ctrl + new_ele_ctrl * MAX_DEFLECTION_PER_SECOND / update_frequency
			# new_thr_ctrl_limited = previous_thr_ctrl + new_thr_ctrl * MAX_DEFLECTION_PER_SECOND / update_frequency

			# update the control positions
			# update_control_position_history((new_ele_ctrl_limited, new_ail_ctrl_limited, 0.0, new_thr_ctrl_limited))
			update_control_position_history((new_ele_ctrl, new_ail_ctrl, 0.0, new_thr_ctrl))

			onground = -1
			if onground == 1:
				print("on ground, not sending controls")
			else:
				if get_autopilot_enabled_from_redis():
					# ctrl = [new_ele_ctrl_limited, new_ail_ctrl_limited, 0.0, new_thr_ctrl_limited]
					ctrl = [new_ele_ctrl, new_ail_ctrl, 0.0, new_thr_ctrl]
					client.sendCTRL(ctrl)

			loop_end = datetime.now()
			loop_duration = loop_end - loop_start

			output = f"current values --    roll: {current_roll: 0.3f},  pitch: {current_pitch: 0.3f},    hdg: {current_hdg:0.3f}, alt: {current_altitude:0.3f}, asi: {current_asi:0.3f}"
			output = output + "\n" + f"hdg error:                 {heading_error: 0.3f}"
			output = output + "\n" + f"new ctrl positions -- ail: {new_ail_ctrl: 0.4f},    ele: {new_ele_ctrl: 0.4f},   thr: {new_thr_ctrl:0.4f}"
			output = output + "\n" + f"PID outputs --   altitude: {altitude_PID.output: 0.4f},  pitch: {pitch_PID.output: 0.4f},   ail: {roll_PID.output: 0.3f},  hdg: {heading_error_PID.output: 0.3f}"
			output = output + "\n" + f"bearing to KBJC: {bearing_to_kbjc:3.1f}, dist: {dist_to_kbjc*0.000539957:0.2f} NM"
			output = output + "\n" + f"loop duration (ms): {loop_duration.total_seconds()*1000:0.2f} ms"
			print(output)
			sleep_until_next_tick(update_frequency)
			os.system('cls' if os.name == 'nt' else 'clear')


if __name__ == "__main__":
	monitor()
And the flask backend/front end. WebSockets are super cool – never used them before this. I was thinking I’d have to make a bunch of endpoints for every type of autopilot change I need. But this handles it far nicer:
from flask import Flask, render_template
from flask_socketio import SocketIO, emit
import redis

app = Flask(__name__)
socketio = SocketIO(app)
r = redis.StrictRedis(host='localhost', port=6379, db=0)

setpoints_of_interest = ['desired_hdg', 'desired_alt', 'desired_speed']
# get initial setpoints from Redis, send to clients

@app.route('/')
def index():
    return render_template('index.html')  # You'll need to create an HTML template

def update_setpoint(label, adjustment):
    # This function can be adapted to update setpoints and then emit updates via WebSocket
    current_value = float(r.get(label)) if r.exists(label) else 0.0

    if label == 'desired_hdg':
        new_value = (current_value + adjustment) % 360
    elif label == 'autopilot_enabled':
        new_value = adjustment
    else:
        new_value = current_value + adjustment

    r.set(label, new_value)
    # socketio.emit('update_setpoint', {label: new_value})  # Emit update to clients
    return new_value

@socketio.on('adjust_setpoint')
def handle_adjust_setpoint(json):
    label = json['label']
    adjustment = json['adjustment']
    # Your logic to adjust the setpoint in Redis and calculate new_value
    new_value = update_setpoint(label, adjustment)

    # Emit updated setpoint to all clients
    emit('update_setpoint', {label: new_value}, broadcast=True)

@socketio.on('connect')
def handle_connect():
    # Fetch initial setpoints from Redis
    initial_setpoints = {label: float(r.get(label)) if r.exists(label) else 0.0 for label in setpoints_of_interest}

    # Emit the initial setpoints to the connected client
    emit('update_setpoints', initial_setpoints)

if __name__ == '__main__':
    socketio.run(app)
And the http template:
<!DOCTYPE html>
<html>
<head>
    <title>Autopilot Interface</title>
    <script src="https://cdnjs.cloudflare.com/ajax/libs/socket.io/4.0.1/socket.io.js"></script>
<script type="text/javascript" charset="utf-8">
    var socket;  // Declare socket globally

    // Define adjustSetpoint globally
    function adjustSetpoint(label, adjustment) {
        socket.emit('adjust_setpoint', {label: label, adjustment: adjustment});
    }

    document.addEventListener('DOMContentLoaded', () => {
        socket = io.connect(location.protocol + '//' + document.domain + ':' + location.port);

        socket.on('connect', () => {
            console.log("Connected to WebSocket server.");
        });

        // Listen for update_setpoints event to initialize the UI with Redis values
        socket.on('update_setpoints', function(setpoints) {
          for (const [label, value] of Object.entries(setpoints)) {
              const element = document.getElementById(label);
              if (element) {
                  element.innerHTML = value;
              }
          }
      });

        // Listen for update_setpoint events from the server
        socket.on('update_setpoint', data => {
            // Assuming 'data' is an object like {label: new_value}
            for (const [label, value] of Object.entries(data)) {
                // Update the displayed value on the webpage
                const element = document.getElementById(label);
                if (element) {
                    element.innerHTML = value;
                }
            }
        });
    });
</script>

</head>
<body>
    <h1>Autopilot Interface</h1>
    <p>Current Setpoints:</p>
    <ul>
        <li>Heading: <span id="desired_hdg">0</span></li>
        <li>Altitude: <span id="desired_alt">0</span></li>
        <li>Speed: <span id="desired_speed">0</span></li>
    </ul>
    <p>Autopilot: <span id="autopilot_enabled">0</span></p>

    <!-- Example buttons for adjusting setpoints -->
    <button onclick="adjustSetpoint('desired_hdg', -10)">-10 HDG</button>
    <button onclick="adjustSetpoint('desired_hdg', 10)">+10 HDG</button>
    <br>
    <button onclick="adjustSetpoint('desired_alt', 500)">+500 ALT</button>
    <button onclick="adjustSetpoint('desired_alt', -500)">-500 ALT</button>
    <br>
    <button onclick="adjustSetpoint('desired_speed', 5)">+5 KTS</button>
    <button onclick="adjustSetpoint('desired_speed', -5)">-5 KTS</button>
    <br>
    <br>
    <button onclick="adjustSetpoint('autopilot_enabled', 1)">Enable Autopilot</button>
    <button onclick="adjustSetpoint('autopilot_enabled', 0)">Disable Autopilot</button>

</body>
</html>
This should be enough to get you going. I’ll come back and clean it up later (both my kids just woke up – 1.5 and 3.5 years!)
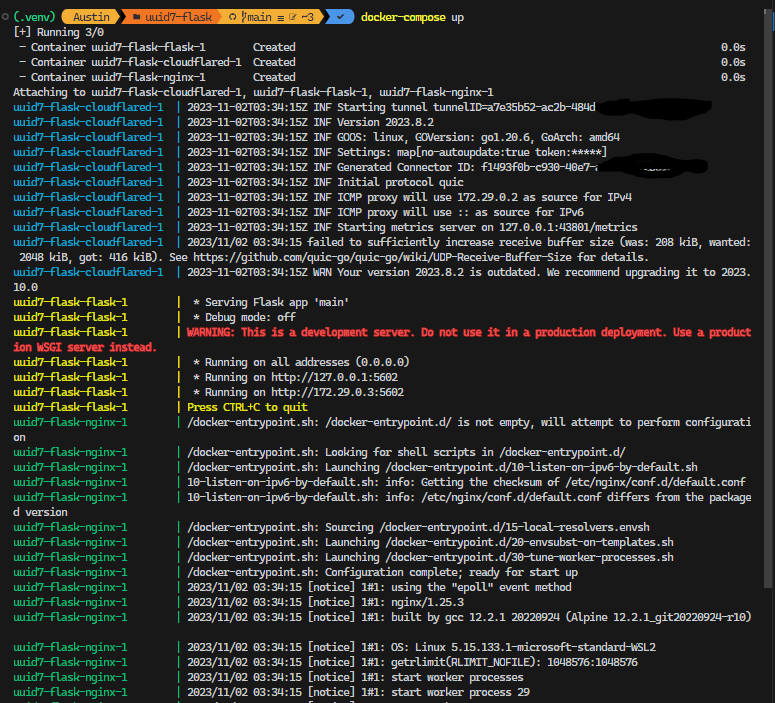
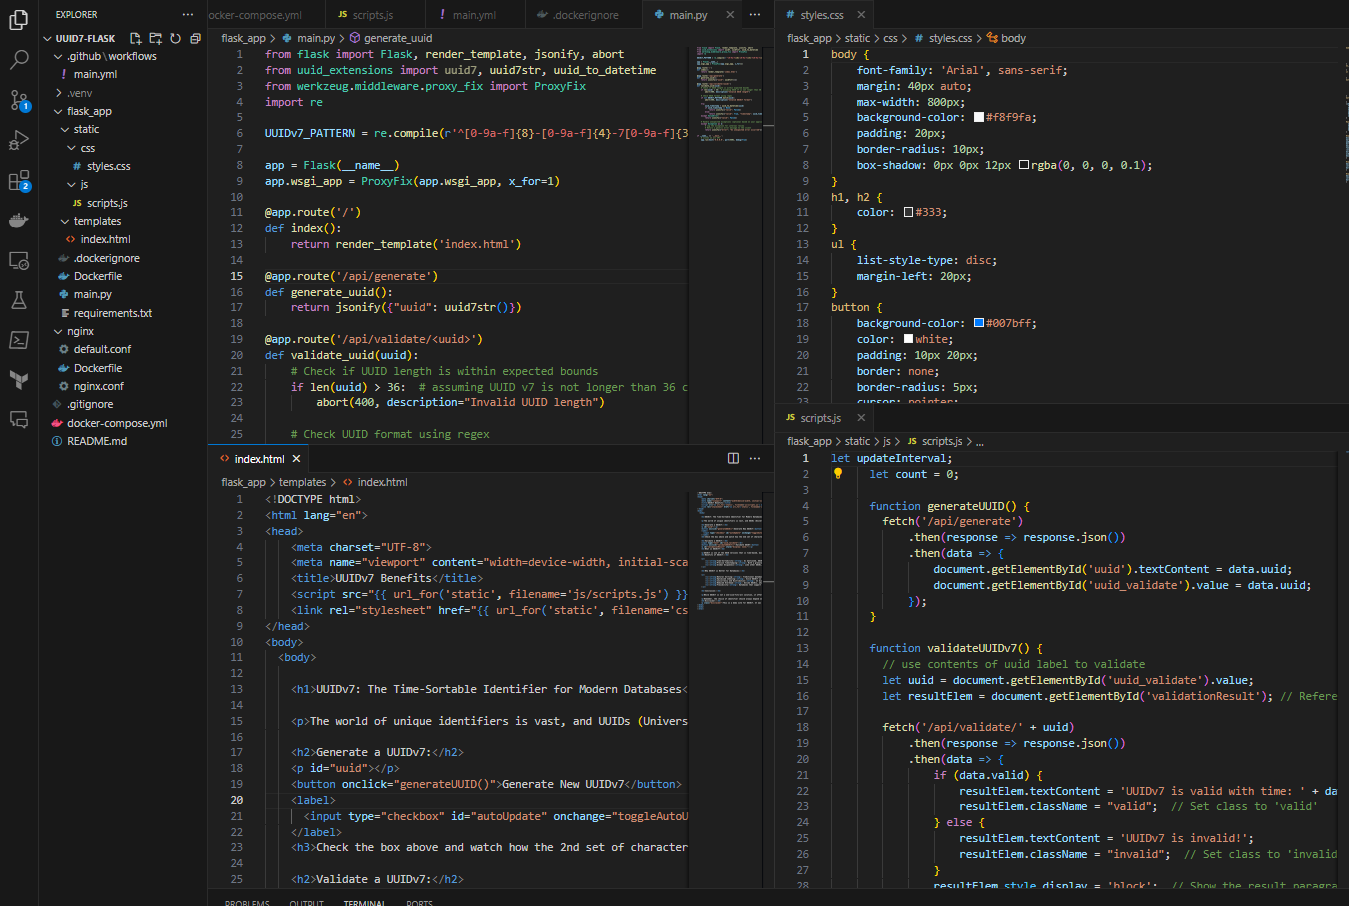
result of docker-compose up showing 3 running containers
Today’s blog post is driven by a desire for simplicity. If you would’ve asked me even a month ago – “Hey Austin, do you think hooking GitHub actions up to deploy a docker-compose application stack is a good way to simplify something?” I 1000% would’ve said no. But I have had to get comfortable with Docker for work over the last couple months. That, combined with some assistance from my favorite AI (GPT4), has led to something I would call “simple”. The first attempt at anything is always a bit rough (one time I did get up on an “air chair” hydrofoil on my first attempt at Seminoe Reservoir in Wyoming though, and earned $100 on a bet for it) but this is a super repeatable pattern.
WARNING ABOUT SECURITY (written by me): This solution does not automatically make your app secure. You still need to have a laser-sharp focus on security. Any vulnerability in your web app can allow an attacker to gain a foothold in your network. Your docker host should be firewalled off from the rest of your network as a first step to prevent traversal into other computers/services/systems in your network. Any steps after that should be focused on the usual attack vectors (SQL injection, keeping systems up to date, etc).
WARNING ABOUT SECURITY (written by ChatGPT): Opening a tunnel directly into your home network can expose internal systems to external threats if not properly secured. Reddit commenters (see https://www.reddit.com/r/homelab/comments/17mc2jg/not_a_fan_of_opening_ports_in_your_firewall_to/) have pointed out that bypassing traditional port-forwarding and firewall configurations can lead to unauthorized access if the tunnel is not adequately protected. The use of Cloudflared or similar tunneling services can alleviate the need for port-forwarding, but without proper security measures, such as robust authentication and encryption, the tunnel could become a vector for malicious activity. It’s crucial to ensure that any tunnel into your (home) network is securely configured to mitigate potential security risks.
Cloudflare tunnels allow for CF to route traffic to your service without port-forwarding. That’s the key for how this all works.
Table of Contents
Components of the stack
Web framework, web server, cloudflare tunnel, GitHub & Actions, docker, docker host, etc
Example website running this stack – uuid7.com (down as of 8:15am 2023-11-03 while I take my own security advice and migrate to it’s own network on my VM host. still getting DNS figured out the the tunnel can be established. back up as of 8:30am, had a block to all internal networks rule, needed to add a allow DNS to DMZ interface before it)
Docker & Docker compose
Self-hosted GitHub runner on a VM
GitHub Actions
Components of the stack
There are quite a few parts of this stack. Also I am not a fan of the word/phrase “stack” for describing these kinds of things but here we are. It really is a stack.
Flask – a basic web framework for getting stuff off the ground quickly. Substitute in any of your own frameworks here. As long as they can listen on a port, you’ll be fine. Django, ASP.NET Core, etc. would all work here.
NGINX – not strictly necessary, but it’s the web server I’m most familiar with. It logs to a standard format, and works well. Some of the frameworks mentioned above do warn against deploying directly to the internet so we stick NGINX in front.
Cloudflared (Cloudflare Tunnels) – these tunnels are super handy. They establish an outbound connection to Cloudflare from whatever they’re running on. Once the tunnel is established, anything destined for your service will go to Cloudflare first (since they are doing the DNS) and from there, it’ll get routed through the tunnel to your service.
Docker – runs containers. Hopefully I don’t need to expand on this.
Docker compose – runs multiple containers in a group. Allows for easy (well “easy” in the sense that each container can talk to each other relatively easily) networking, and ability to stand up a “stack” of related containers together.
GitHub – hosts code. Also not expanding on this
GitHub Actions – triggers actions when various criteria are hit for your repository hosted on GitHub (for example, pushing a new docker compose file when committed to main)
A host running Docker (your desktop/laptop, Linux VM, AWS EC2 instance, etc.)- place for the docker stack to be deployed
Self-hosted GitHub runner – place where the action is run when code is committed to main
Okay so now that I’ve wrote out that list, it is not exactly simple. But is is repeatable. Realistically, the only part you’ll change is Flask and the docker-compose.yml file. The rest are somewhat copy + paste.
Example website running this stack – uuid7.com
Like quite a few of you reading this, I buy domains far before I actually do anything with them. I have a side project I’m working on (a “Tinder for Restaurants”), and decided on GUIDs/UUIDs as the IDs for all my tables. UUIDv4 turns out to not work well with database indexes because it is not sequential. UUIDv7 is and works great (it has a time component as well as some randomness). I wanted to make a simple site to demonstrate UUIDv7s hence uuid7.com was born about a month ago. Screenshot below:
Screenshot of uuid7.com, which was styled by GPT4 (I am not a UI/UX person at all)
uuid7.com components
This is a pretty straight-forward site. There is a main.py which is the entry point for the Docker image, a styles.css, scripts.js, and an index.html template.
Screenshot of VSCode showing the 4 main aspects of uuid7.com
A typical set of NGINX log entries for a real person visiting the site with a real browser is such:
5 lines of NGINX logs for a visit, one for each part of the site and a 404 for the favicon
As you might expect, the site loads fairly quickly:
firefox dev tools showing the site loads in 0.3-0.5 seconds
Docker & Compose
I’m not going to elaborate on how Docker works. The Dockerfile for the flask app is 7 lines (see below). We are getting the Python 3.11 base image, copying the code, installing flask and uuid7, exposing a port (which I don’t think is strictly necessary), defining an entry point and the file to run. Doesn’t get much easier than this.
FROM python:3.11
WORKDIR /app
COPY . .
RUN pip install flask uuid7
EXPOSE 5602
ENTRYPOINT [ "python" ]
CMD ["main.py"]
Do note that I am running Flask on port 5602:
if __name__ == '__main__':
    # listen on all IPs
    app.run(host='0.0.0.0', port=5602, debug=True)
Ah but you might say “Austin, I thought you also had Cloudflare Tunnels and NGINX going?”. And you would be right.
There is no NGINX “app” container, just two config files (a “default” NGINX-wide one called nginx.conf and a site-specific one called default.conf).
For the site specific config, we are just saying, listen on port 8755 for SSL requests, use the defined cert and key, and pass everything to the container named “flask” via port 5602. You are free to use whatever ports here you want. There are multiple (nginx listen port -> flask listen port). The IP/Forwarded headers are so NGINX can log the real requester and not the Cloudflare server that forwarded the request. If you do not do this step, it will look like all of your customers/clients are coming from cloudflare and you’ll never see their real IPs.
For the NGINX-wide config, there is fairly standard stuff. I copied + pasted most of this from the real default config. I did customize the log format to include the upstream request time which I like to see (this is how long it takes the upstream server, be it Flask or php-fpm or ASP.NET core takes to turn around the request). The IP addresses listed are Cloudflare servers and are where I should believe them when they say they’re forwarding from someone else. Note the last CIDR listed – 172.29.0.0/16. This is the docker network. There is actually a double forward going on and this is also necessary (real_ip_recursive is set to on).
The NGINX Dockerfile does some magic in that it generates an unsigned SSL certificate so that things “work” via HTTPS (couldn’t figure out how to do plain HTTP within the docker compose but HTTPS externally). There is an option in the Cloudflare Tunnel to ignore SSL errors, which is enabled.
The Cloudflare Tunnel container is so simple there isn’t even a Dockerfile for it, just an entry in the docker-compose.yml.
Which brings us to the docker-compose.yml file. This is the “secret sauce” that brings it all together. This file defines a “stack” of related containers that form an application. This is still somewhat magic to me.
Since it is magic, and I am still learning how to describe these various concepts, ChatGPT did a decent summary:
This docker-compose.yml file outlines a multi-container Docker application, specifically designed to run a Flask application behind an NGINX reverse proxy, with a Cloudflare tunnel for secure and fast network connections. The file is written in version 3.8 of the Docker Compose file format, ensuring compatibility with newer features and syntax.
Flask Service
The flask service is configured to build a Docker image from a Dockerfile located in the ./flask_app directory. The Dockerfile should contain instructions for setting up the Flask application environment. The FLASK_RUN_HOST environment variable is set to 0.0.0.0, allowing the Flask application to be accessible from outside the Docker container. The restart: always directive ensures that the Flask service is automatically restarted if it stops for any reason.
NGINX Service
The nginx service also builds its Docker image from a Dockerfile, which is expected to be in the ./nginx directory. This service is set up as a reverse proxy, forwarding requests to the Flask application. The ports directive maps port 8755 on the host machine to port 8755 inside the Docker container, making the NGINX server accessible from outside. The depends_on field specifies that the NGINX service depends on the Flask service, ensuring that Docker Compose starts the Flask service before starting NGINX. Like the Flask service, NGINX is configured to restart automatically if it stops.
Cloudflared Service
The cloudflared service utilizes the official Cloudflare tunnel image and runs the Cloudflare tunnel with the specified command. The CF_TOKEN environment variable, which should contain your Cloudflare tunnel token, is passed to the container through the command line. This service is also configured to restart automatically if it stops.
Networking
By default, Docker Compose sets up a single network for your application, and each container for a service joins the default network. In this case, an IPAM (IP Address Management) configuration is specified with a subnet of 172.29.0.0/16, ensuring that the containers receive IP addresses from this specified range.
The Cloudflare Tunnel
If you don’t have one already, create a cloudflare account, and add your domain and prove ownership. Then go to Cloudflare zero trust area (usually under the access link). Create a tunnel. The token is the long alphanumeric string in the code box for any of the environment types. It always starts with ‘ey’:
Cloudflare tunnel with token
On the public hostname part, you need a minimum of the domain, type, and url. Here, the domain is obvious. It is going over HTTPS mostly because, again, I couldn’t figure out how to get it to do plain HTTP within the compose stack. The port here is where NGINX is listening and the hostname is the name of the NGINX container (simply ‘nginx’).
uuid7.com cloudflare tunnel settings
docker-compose up!
Replace ${CF_TOKEN} in your docker-compose.yml with the actual token for testing on your local machine. Then from the same folder that contains docker-compose.yml, run:
docker-compose up
The images will be built if necessary, and after they are built, they will be started and you’ll see output that looks something like this:
results of docker-compose up, 3 running containers
To kill, just do a Ctrl-C and wait for them to gracefully exit (or not).
A Place for the Stack to Live
We need a host where the docker stack can live and exist in a 24/7 uptime world. This is typically not your dev machine. I have a Dell R630 in a datacenter in the Denver Tech Center area. That will suffice. Create a VM/VPS somewhere (on a R630 in a datacenter, Azure, DigitalOcean, AWS EC2, etc), and install docker on it. Make sure you also install docker-compose. Further make sure you don’t install Docker on the Proxmox host by accident (oops). Then, install a self-hosted GitHub runner on the VM/VPS as well.
Create a secret in your repo with the Cloudflare Tunnel token, and name it the same thing as in your docker-compose.yml file (be sure to change that back!). I am using CF_TOKEN, which is represented in the docker-compose.yml file:
What your GitHub secrets will look like with a secret added:
GitHub Actions
Lastly, we need to define some actions to take place when certain events happen. In our case, we are interested in when the ‘main’ branch of the repo changes. This is my full .github\workflows\main.yml file:
name: Docker Deploy

on:
  push:
    branches:
      - main

jobs:
  deploy:
    runs-on: self-hosted
    steps:
      - name: Checkout Code
        uses: actions/checkout@v2

      - name: Set up Docker Compose
        run: echo "CF_TOKEN=${{ secrets.CF_TOKEN }}" >> $GITHUB_ENV

      - name: Navigate to Code Directory
        run: cd ${{ github.workspace }}

      - name: Run Docker Compose Up with Sudo
        run: sudo -E docker-compose up -d --build
Now, when you commit, it will reach out to your self-hosted runner, which will pull your code, insert the CF_TOKEN secret into the environment variables, and then run the docker-compose up command to get your stack going. Here are a couple executions. You will likely have a couple misfires when setting up the pipeline if you are doing something different than me. My record is 19 tries (read: failures) in Azure DevOps to get a build/release pipeline fully functional.
Conclusion
This post turned out to be far longer than I anticipated. I hope you find it helpful! As noted earlier, the vast majority of this is essentially copy + paste. By that, I mean once you do it once, you can easily do it again. You can run these docker compose stacks pretty much anywhere.
There is a “feature” of Cloudflare Tunnels in that they say they are randomly routed if there is more than one active tunnel. I have not tested this but this allows for some interesting possibilities. For sites that have zero persistence, like the uuid7.com example site, that means I can run this stack in more than one place for redundancy by just doing a git pull/docker-compose up.
Docker containers take very little memory/CPU:
output of ‘docker stats’ showing this stack taking a total of ~40MB memory and 0.76% of 2 vCPUs of a Xeon e5-2697v4