This project exists because I bought 30 sticks of 16GB DDR4-3200 RDIMM for an EPYC build in early April: an r/homelabsales find at $80 a stick, which was a fair price that day. The problem is that “that day” turned out to be the exact top of the market. Buying the top is pretty standard for me. Then the server wouldn’t POST with at least 4 of the sticks installed, and of the 16 that made it in, 4 more start throwing ECC errors the moment I do anything memory-heavy (LLM inferencing, which is of course why I bought them). There are still 6 untested sticks in the box. I knew the going rate; what I couldn’t see was where prices were headed or which sticks would actually work. A price tracker with real sold history fixes at least the first problem.
Beyond my own bad luck, the general problem is that eBay search results for server RAM are a mess. “32GB (2x16GB)” is two 16GB sticks, not one 32GB stick. The same 2666 MT/s speed shows up as DDR4-2666, PC4-21300, PC4-2666V, or just “2666V” depending on the seller’s mood. Lots of 8, lots of 32, single sticks, and “FOR PARTS” boards are all mixed together in the same results. Comparing actual price per gigabyte across all of that by hand is miserable.
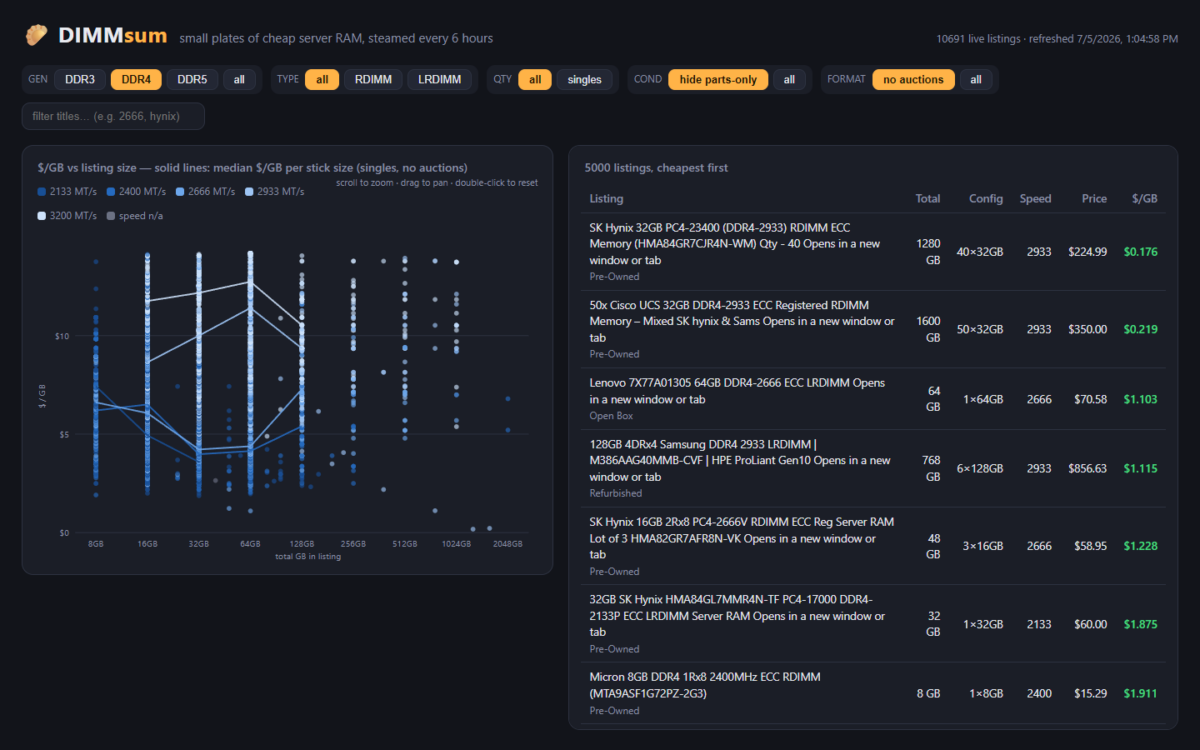
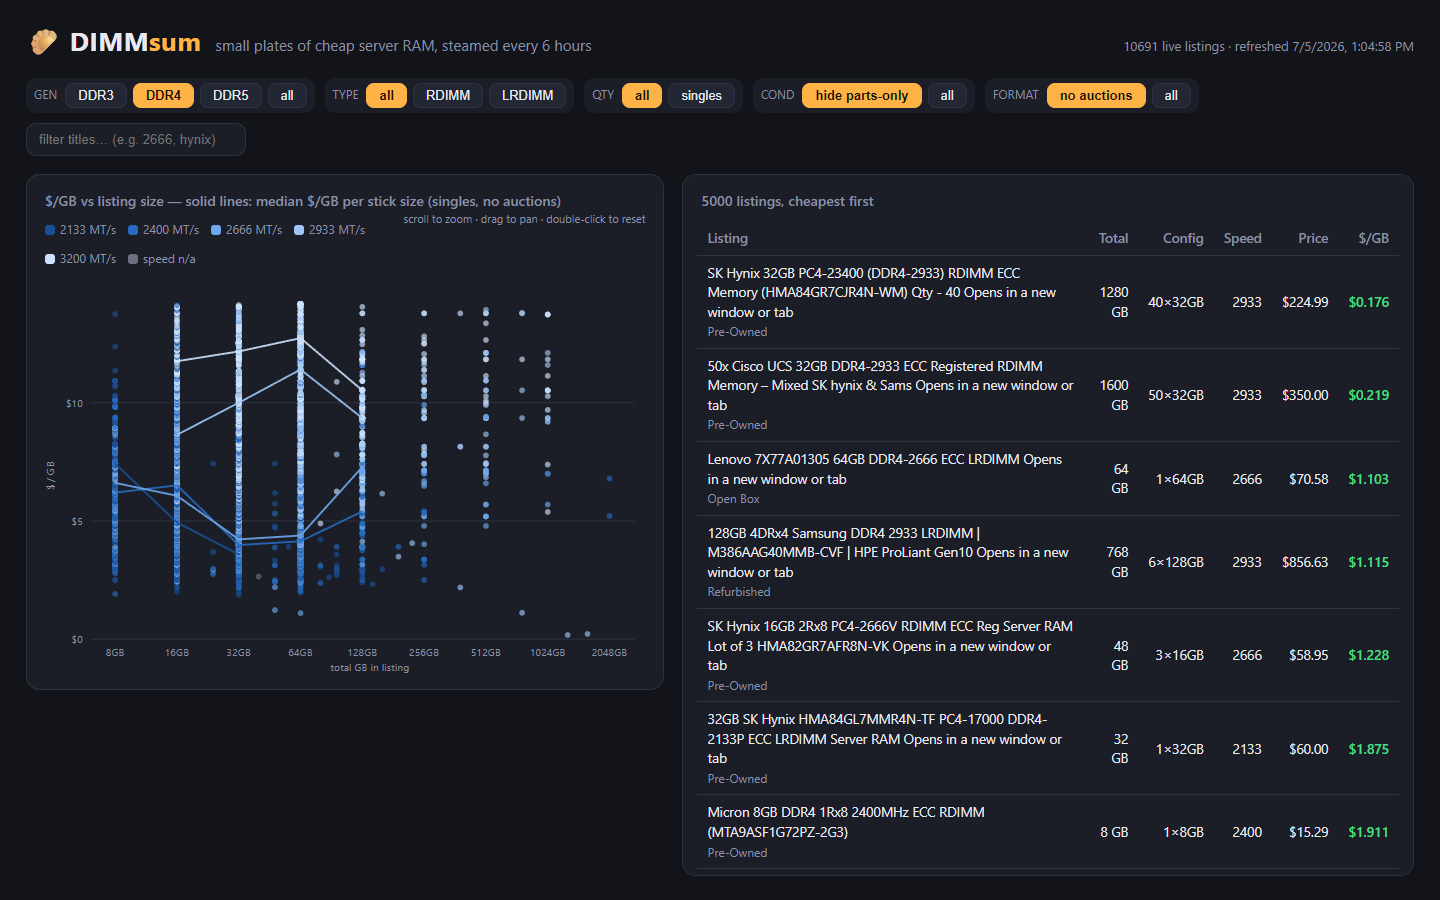
LabGopher solved this years ago for whole servers, and I have wanted the RAM equivalent basically forever. So I built it: DIMMsum, a free site that scrapes eBay every 6 hours, normalizes the listing titles with an LLM, and charts everything as $/GB with median market lines per speed grade.
Welcome to Austin’s Nerdy Things, where we deploy a browser farm and a language model to avoid doing mental math on eBay listings.
My first attempt (2024) was bad
This is actually my second run at scraping eBay. Back in 2024 I wrote a requests + BeautifulSoup scraper that pulled search results through free SOCKS proxies from public proxy lists. It mostly worked, in the sense that it is technically still running on an LXC in my basement, appending to a parse.log that is now 636MB. The proxies were garbage (free proxies are free for a reason), the regex title parsing was wrong constantly, and I never did anything with the data. Classic.
Two things changed since then: eBay got much more aggressive about blocking scrapers, and LLMs got cheap enough to throw at every single listing title. Both of those turned out to matter a lot.
eBay does not want to be scraped (by robots that look like robots)
The 2024 approach is completely dead in 2026. Plain HTTP clients like requests do not even get to say hello anymore – eBay identifies them as robots essentially instantly and serves a 403 or the “Pardon Our Interruption” page. My first attempts with an automated browser got generic eBay error pages on search URLs too, while the exact same URLs worked fine by hand. That one had me confused for a while.
I am going to spare you the play-by-play here, partly because it would be a bot-evasion cookbook published by a site that participates in eBay’s own affiliate program, which seems unwise. The short version: the fix was embarrassingly simple, and it amounted to using a real browser (Playwright driving full Chromium) and having it behave like a polite human instead of a robot in a hurry. Take the path a person would take, slow down, keep the footprint small. No proxies, no stealth plugins, one IP, 3-6 second randomized delays between pages, and eBay has been perfectly happy serving me 240 listings per page ever since – a few hundred page loads a day, total.
The query matrix (or: making the search do half the parsing)
Instead of one broad “ddr4 rdimm” search, DIMMsum runs 51 very specific queries, one per capacity + speed + module type combo:
32gb (2666,pc4-21300,2666v) rdimm -2x16 -4x8 -8x4The parenthesized part is eBay OR syntax covering the speed synonyms, and the negative terms exclude kit notation so results skew toward true single sticks. The neat part is that each query doubles as a weak label: if a listing was found by the 32GB 2666 RDIMM query but parses out as a 16GB stick, something is off (a lot, a mislabel, or a parse bug), and it gets flagged with a little warning icon in the UI instead of silently polluting the chart.
LLM title parsing for $0.09 per thousand listings
Here is a real title from the database:
2048GB 128x16GB DDR3 PC3L-10600R ECC Reg Server Memory RAMThat is 128 sticks of 16GB low-voltage DDR3-1333 RDIMM. My 2024 regex parser had no chance. The domain rules are genuinely fiddly: a PC3L prefix means low voltage, but a trailing L on the PC number (PC3-14900L) means LRDIMM, and both can appear in the same token. Kit notation states the total first. “LOT” without a count does not mean quantity greater than one. Part numbers are more authoritative than the title text around them.
Rather than encoding all that in regex, every title goes through DeepSeek (deepseek-v4-flash, their cheap model) with a system prompt full of those domain rules, returning structured JSON validated by a pydantic schema:
class RamSpec(BaseModel):
    is_ram: bool          # False for trays, heat spreaders, "for parts" boards
    qty: Optional[int]    # lot/kit aware stick count
    per_stick_gb: Optional[int]
    total_gb: Optional[int]
    ddr_gen: Optional[int]        # 3, 4, 5
    module_type: Optional[str]    # RDIMM | LRDIMM | UDIMM | SODIMM
    speed_mts: Optional[int]      # PC4-21300 -> 2666
    # ... rank, voltage, ECC, part number
Titles are batched 25 per API call with an index round-trip check so a misaligned response fails loudly instead of assigning specs to the wrong listings. Against a hand-labeled fixture set it scored 97.4% field accuracy on the first eval run, and the misses were fields that only existed encoded inside part numbers (a future deterministic PN-decode layer will catch those).
The economics are the part that still makes me smile. At roughly $0.09 per 1,000 titles, the total LLM bill for parsing every listing DIMMsum has ever seen is about two dollars. This pipeline was not possible on a hobby budget three years ago; now it is basically free.
The plumbing
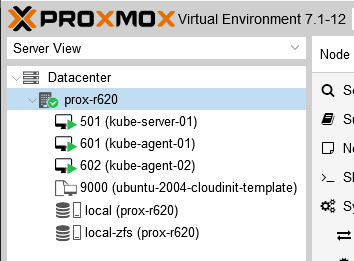
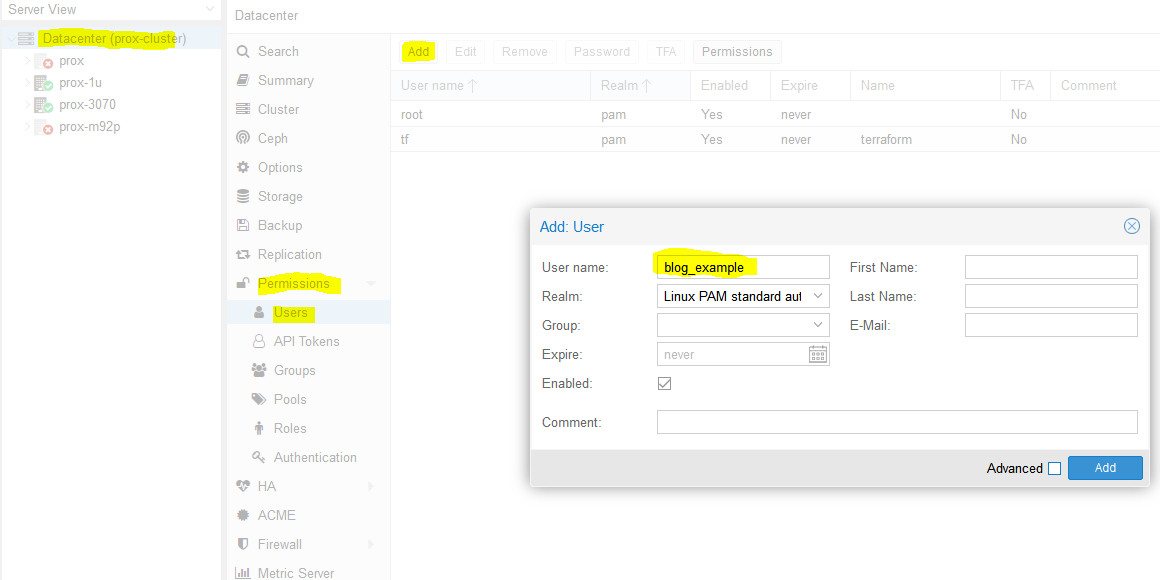
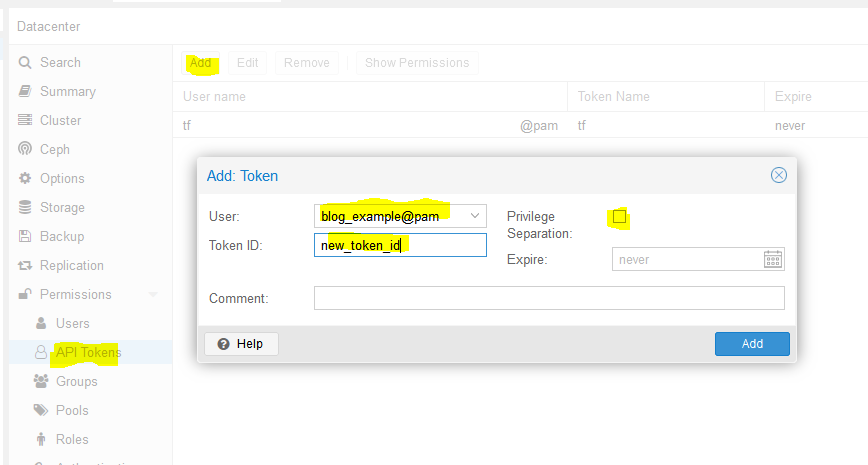
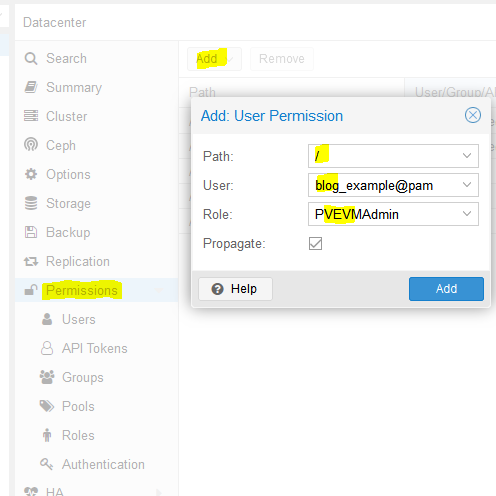
Everything lands in Postgres on my Proxmox cluster (one VM for the scraper + web app, one for the database). A systemd timer scrapes every 6 hours, and each run records a price snapshot per listing, which means DIMMsum builds its own price history for every item it tracks. The web side is FastAPI plus one vanilla JavaScript file. No framework. The whole site is a scatter chart, a table, and some server-rendered spec pages.
Current state of the database after a few days of running:
| Metric | Count |
|---|---|
| RAM listings tracked | 10,697 |
| Price snapshots | 104,475 |
| Search queries per run | 51 |
| Scrape frequency | every 6 hours |
| LLM parse cost, lifetime | ~$2 |
Claude (Fable 5, via Claude Code) wrote most of this code with me over a few evenings. The architecture arguments were real arguments and it lost some of them, but I will happily credit it with the claim-column work queue pattern that lets me run parallel parse workers against Postgres without them stepping on each other.
Sold prices (the part I am most excited about)
Active listing prices tell you what sellers are asking. Sold prices tell you what buyers actually paid, and those are very different numbers on eBay.
I assumed for months that scraping sold/completed listings was off the table and never actually tested it. Turns out the same polite-human browsing approach handles the sold/completed view just fine, and eBay hands you sold prices with dates, 240 per page. I was wrong for months for no reason. Test your assumptions, folks.
So as of this week DIMMsum also harvests sold listings weekly into their own table. The first sweep pulled in over 8,000 real sales, and the sold history goes back further than the ~90 days I expected (most of the usable volume reaches back to late 2025). That data is going to power a monthly “state of the used RAM market” report: median $/GB by SKU, month over month, from real transactions. The June data already shows 8GB DDR4-2133 RDIMMs sliding from $3.50/GB in April to $3.12 in June, and that is exactly the kind of thing I want a monthly email about.
There is a signup box at the bottom of dimmsum.com for exactly that report. One email a month, actual data, no other nonsense.
Disclosure and what’s next
The site is monetized with eBay Partner Network affiliate links: if you click through and buy, eBay pays a commission. That is the entire business model. Free site, no ads, no accounts, and the full disclosure lives in the footer.
Next up: the monthly sold-price report, a storage version (same idea, $/TB for used enterprise SSDs and HDDs, already in progress as a separate project), and a part-number decode table to squeeze out the last few percent of parse accuracy.
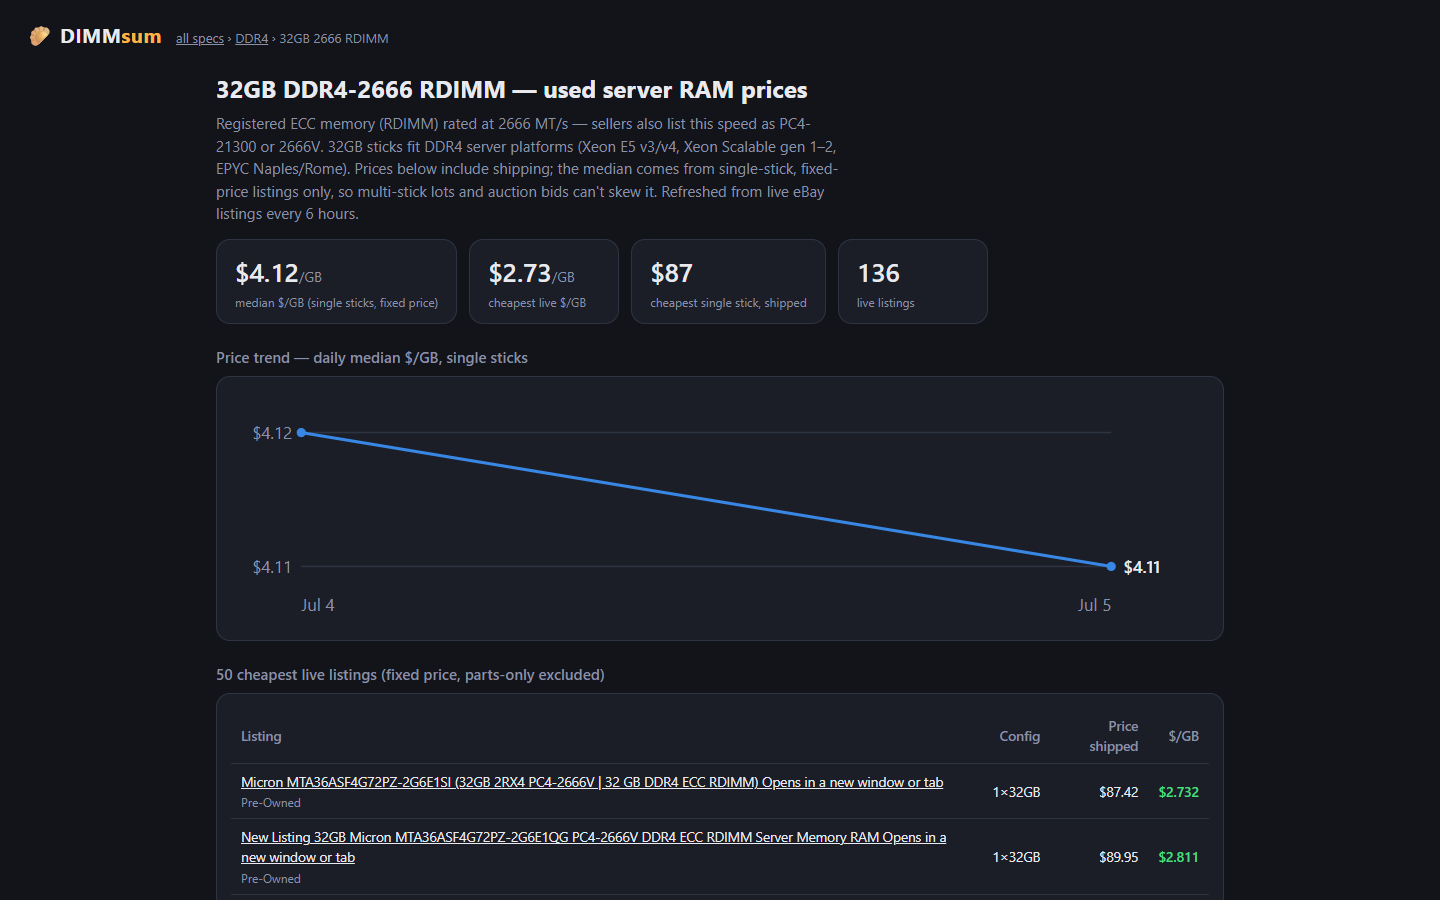
Go find some cheap RDIMMs at dimmsum.com. My benchmark SKU (32GB DDR4-2666 RDIMM singles) has a median around $132 a stick right now with the floor meaningfully below that, and now I get to watch the market instead of refreshing eBay searches like an animal.