Welcome to Austin’s Nerdy Things, where we spend years chasing nanoseconds that nobody asked us to chase.
Five years ago, I started this blog by building a microsecond-accurate NTP server with a Raspberry Pi and PPS GPS. Then I went simpler – a $12 USB GPS for millisecond-accurate NTP because ease of use matters too. Then I spent months doing thermal management on the CPU to squeeze out another 81% improvement. My beloved Raspberry Pi 3B has been sitting at around +/- 200 nanoseconds for over a year now, and I figured that was about as good as it gets for consumer hardware.
A $20 eBay purchase from two years ago just demolished all of that.
The Hardware: Telecom Surplus for Pocket Change
The key piece is an Oscilloquartz OSA-5401 – a GPS-disciplined PTP grandmaster clock in an SFP form factor. These things were designed to plug into telecom switches and provide IEEE 1588 Precision Time Protocol timing for cellular networks. They have a built-in GPS receiver, an OCXO (oven-controlled crystal oscillator), and an FPGA that handles hardware PTP timestamping. New, they cost thousands of dollars. On eBay, a handful of decommissioned units went for $20. Now they’re unavailable. If they do appear (rarely), they’re $300-500.
I first spotted these on a ServeTheHome forum thread back in 2024. Someone found a batch on eBay for $20 each and I jumped on one. The firmware doesn’t include the NTP server feature from the spec sheet (that requires a license), but it spews PTP multicast frames on power-up – and that turns out to be all you need. I posted the first working PTP+chrony config in that thread, which others used as a starting point.
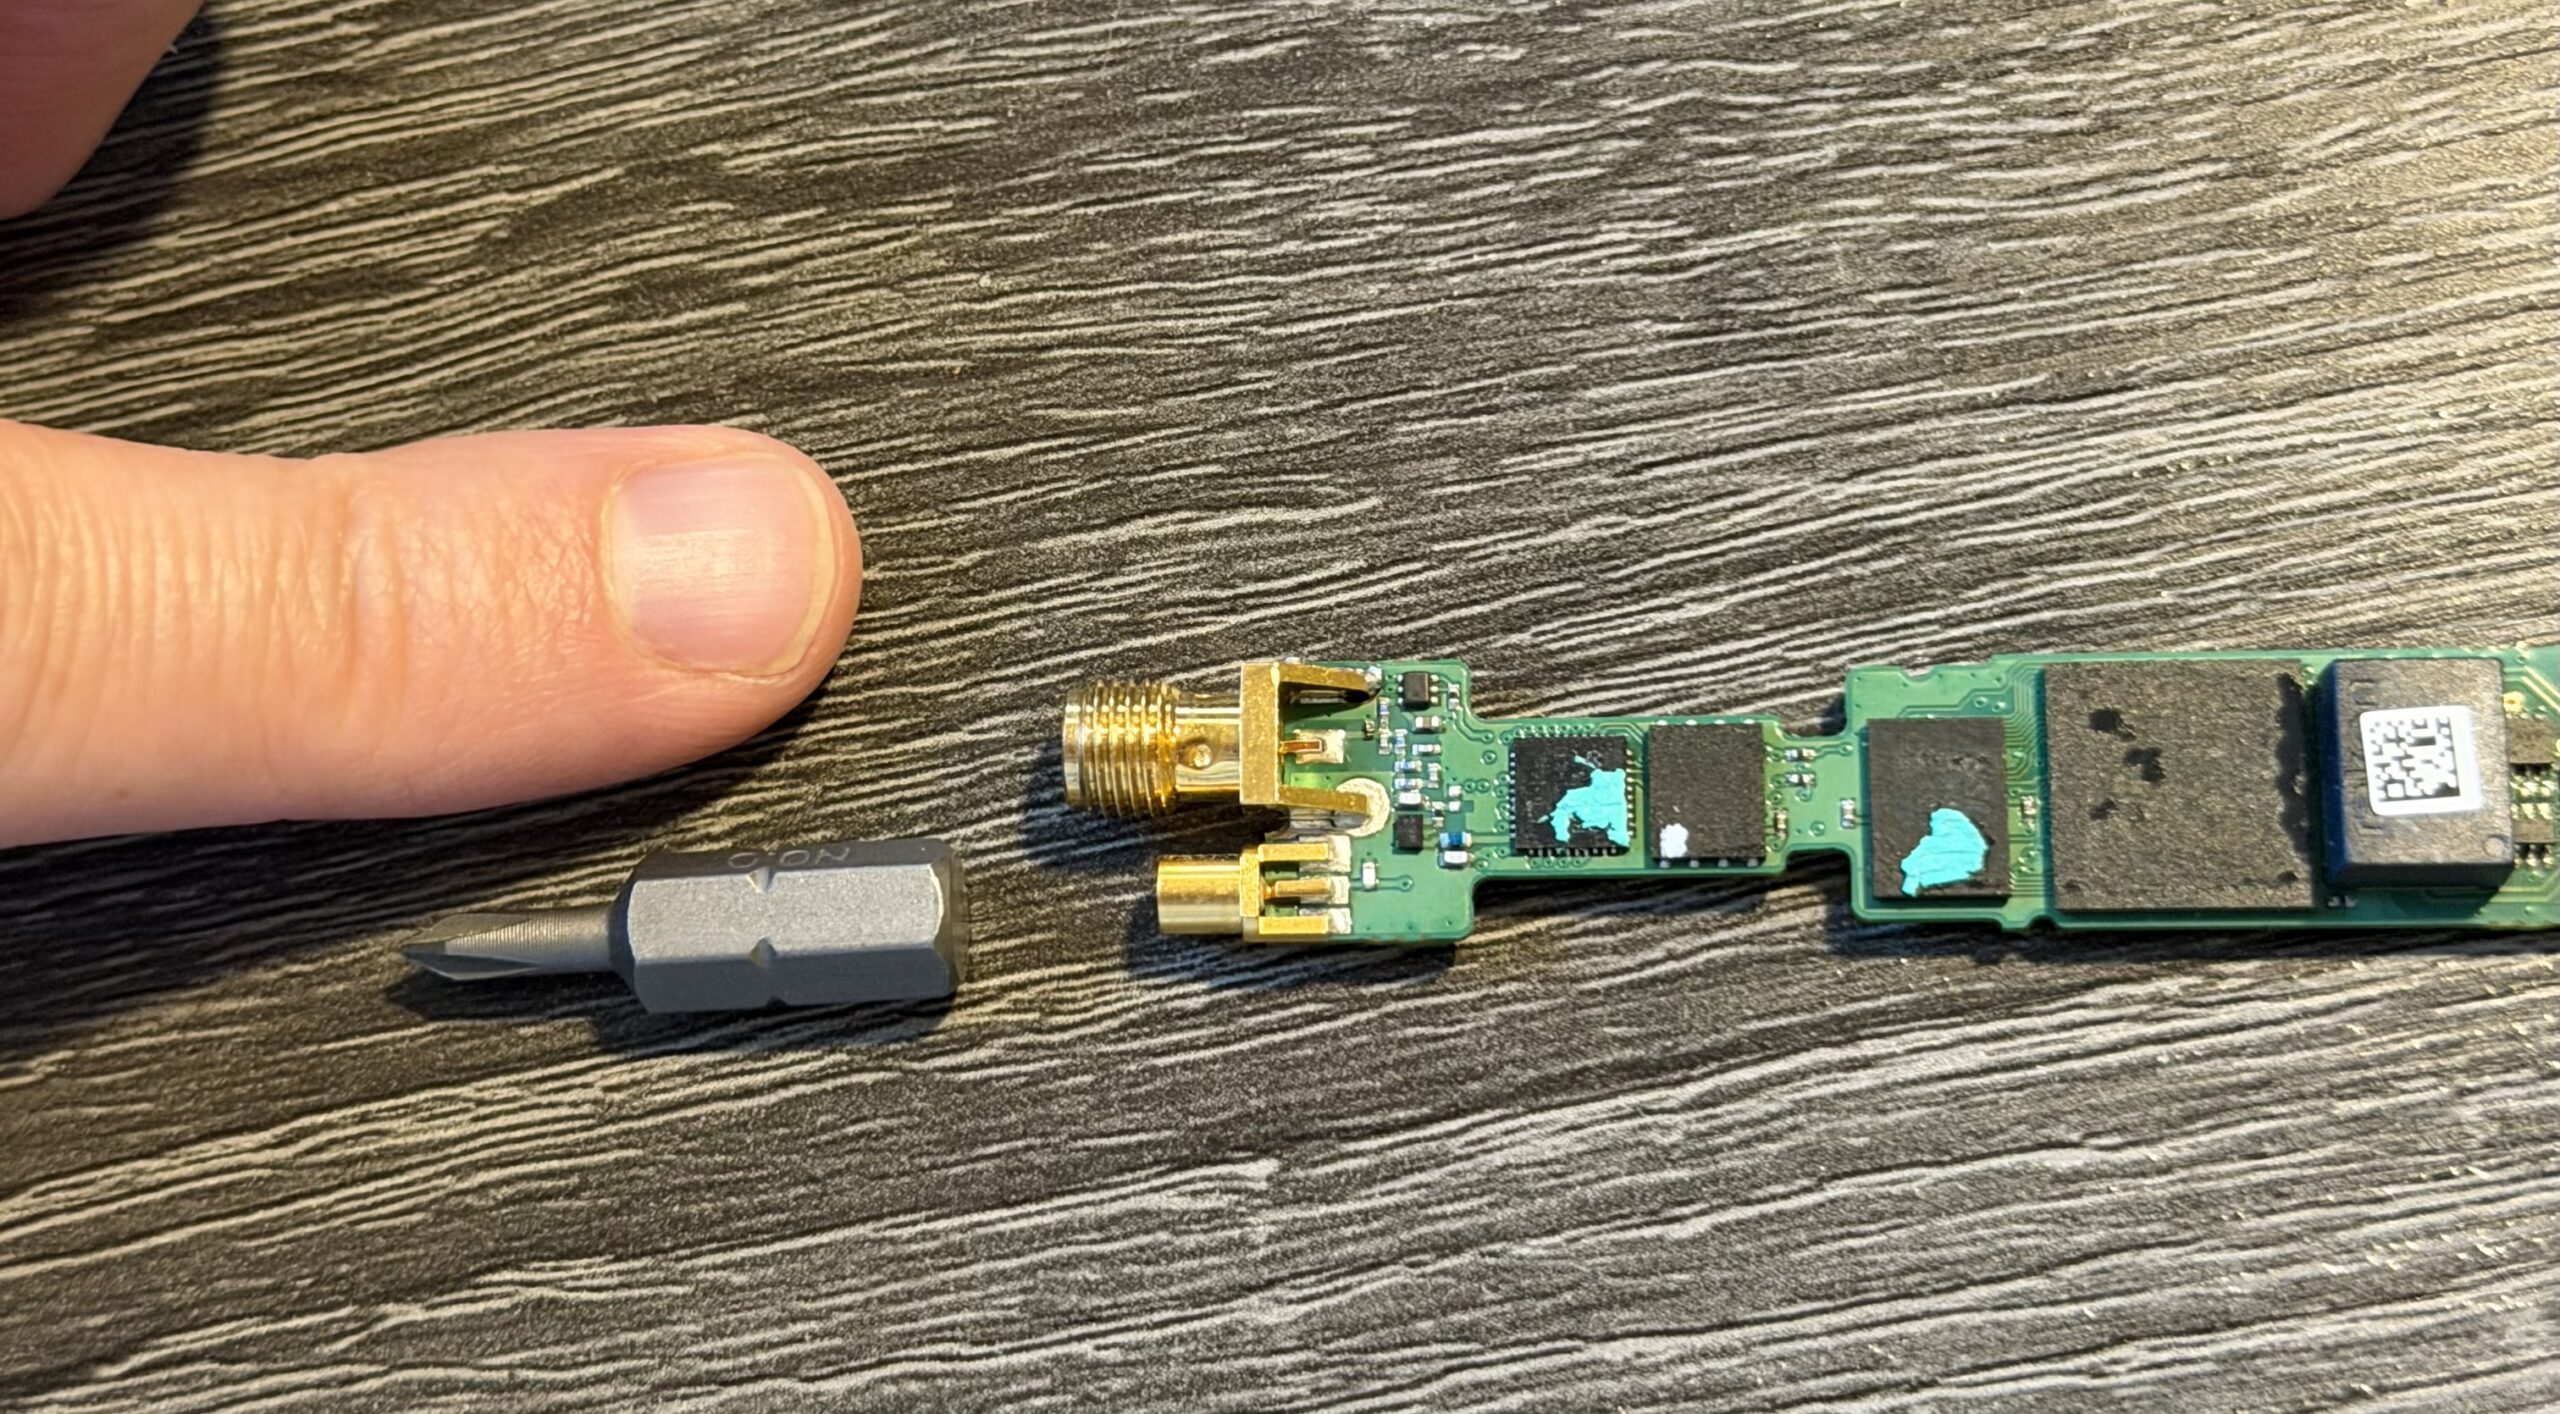
Mine was flaky from the start – the antenna would intermittently disconnect. I reported in the thread that “wiggling the module helped,” which in retrospect should have been a bigger clue. When I finally pulled the board out of the SFP housing, I found the GNSS SMA connector had broken loose from the PCB – probably cracked during decommissioning. A few minutes with a soldering iron fixed that, and it’s been rock solid since. Here’s the board with the resoldered connector, screwdriver bit for scale:
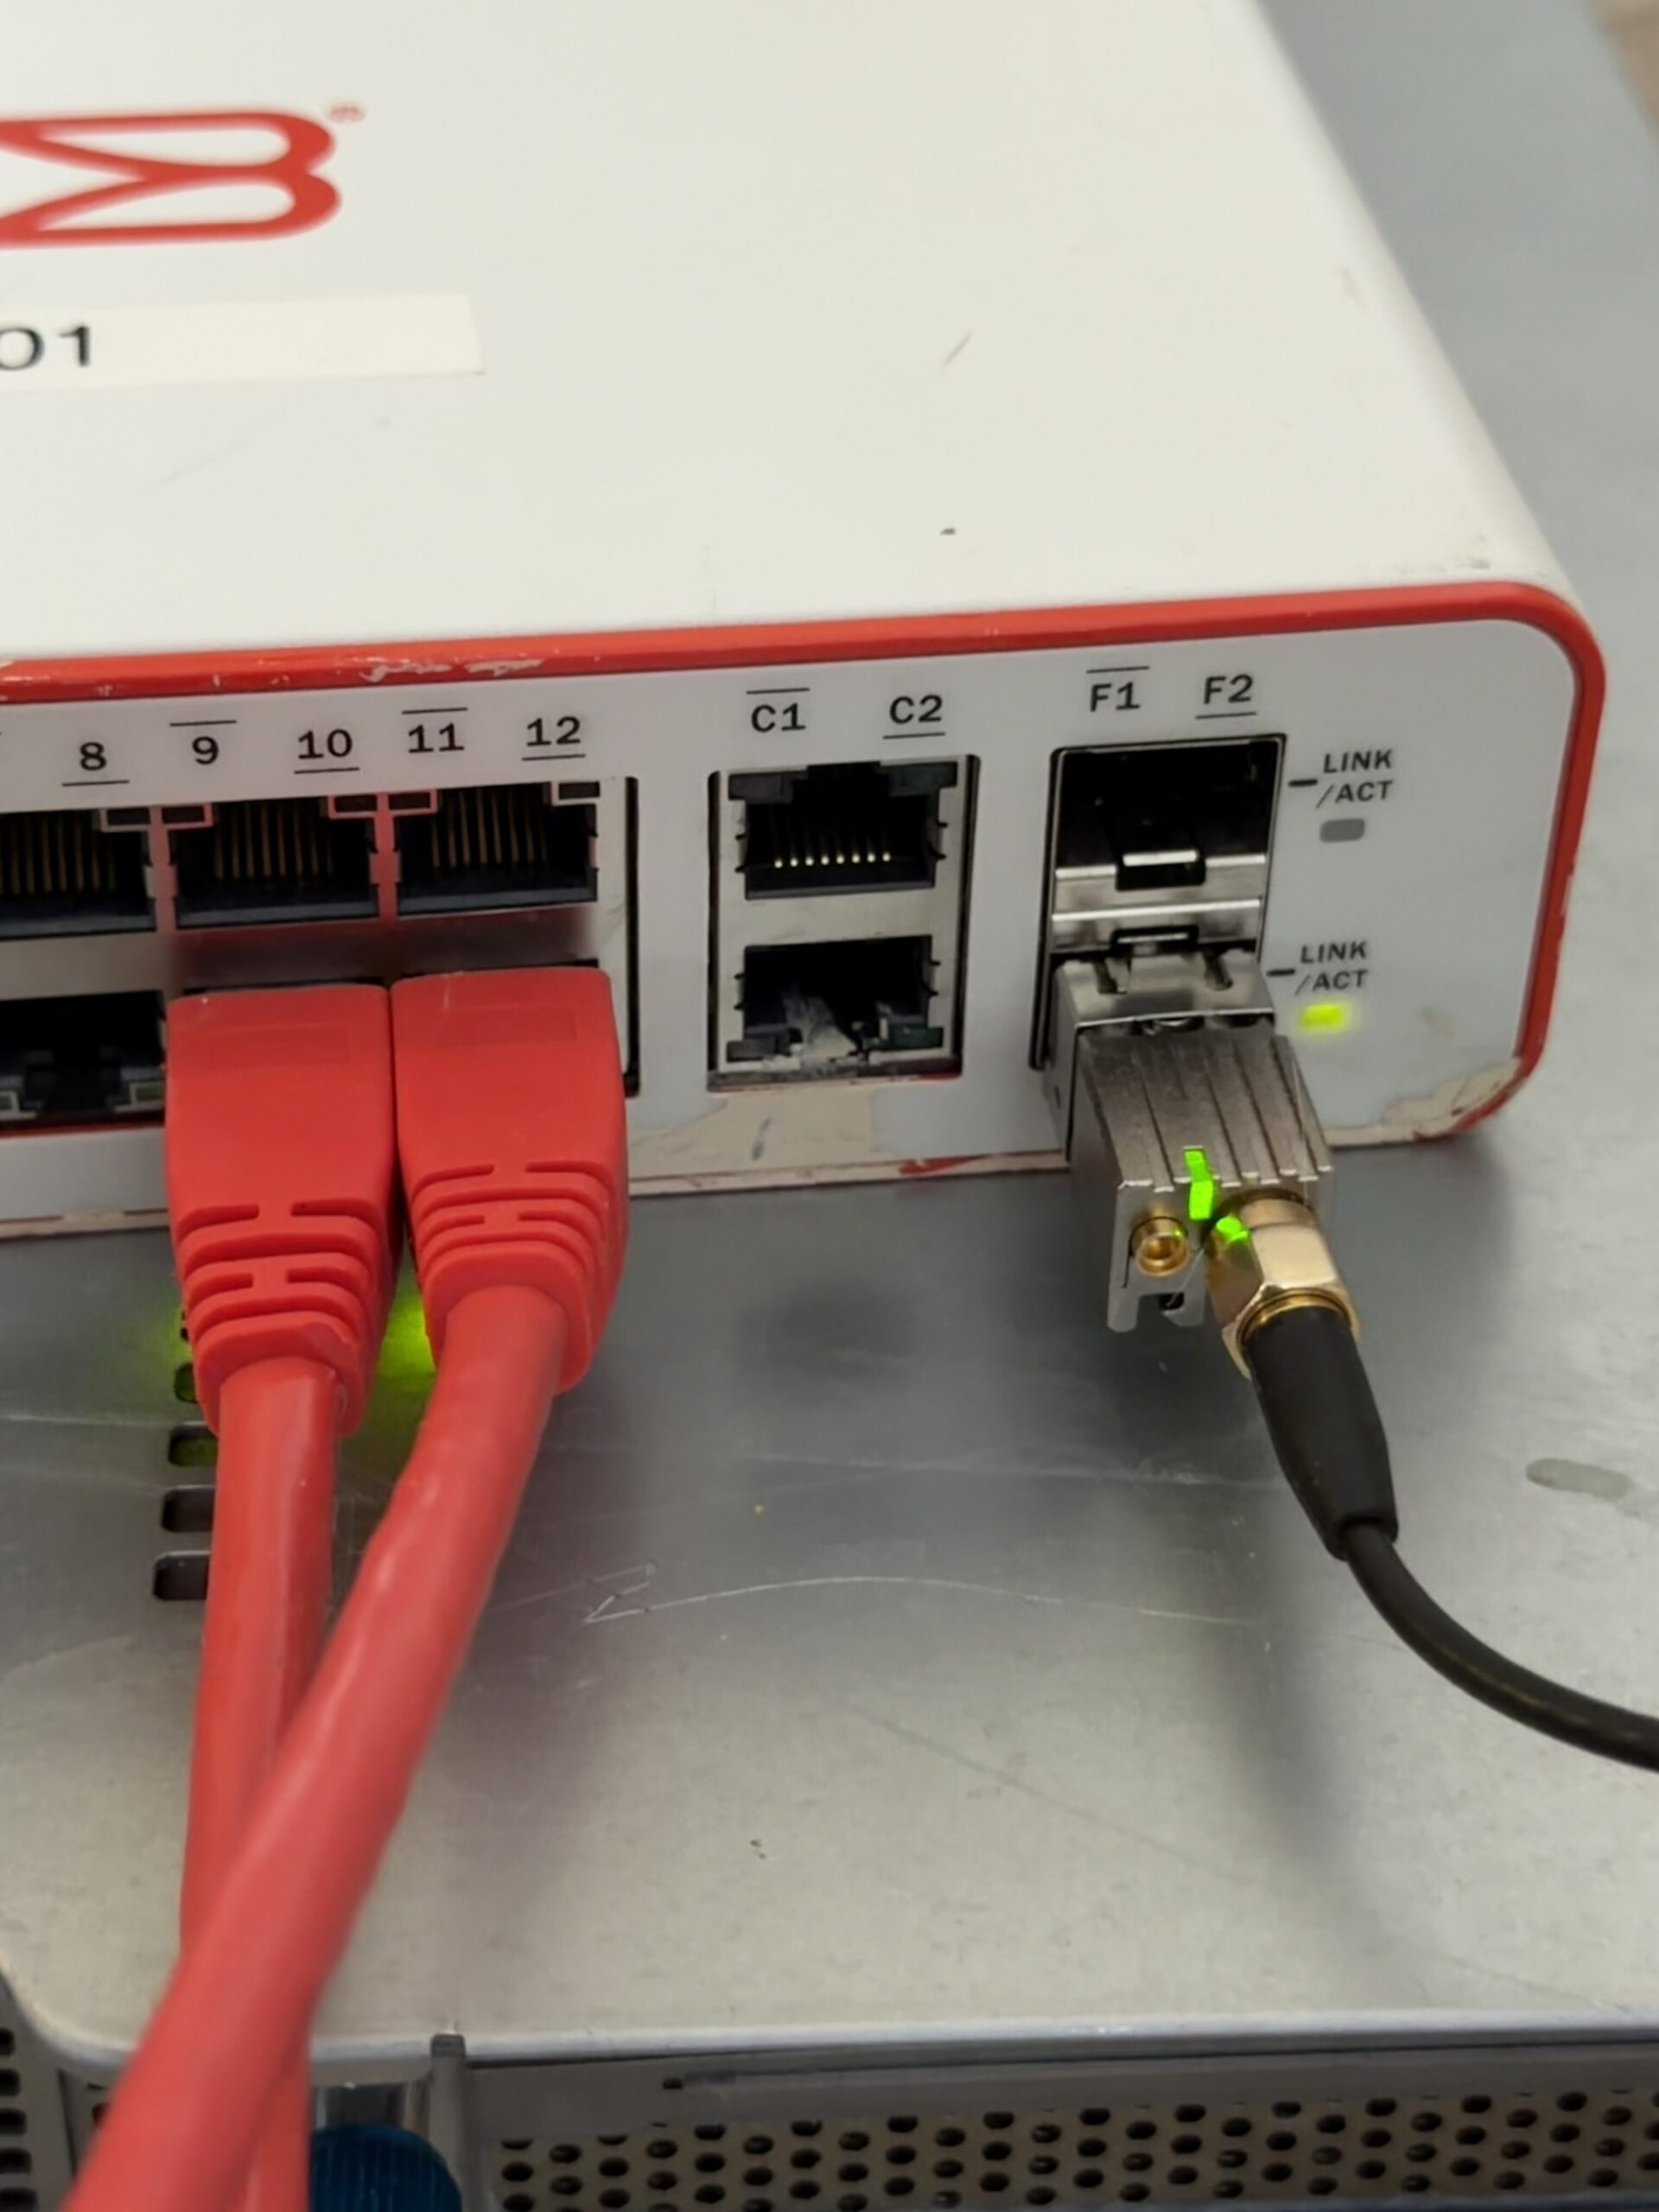
And installed in port F2 of a Brocade ICX6430-C12 switch, GPS antenna connected:
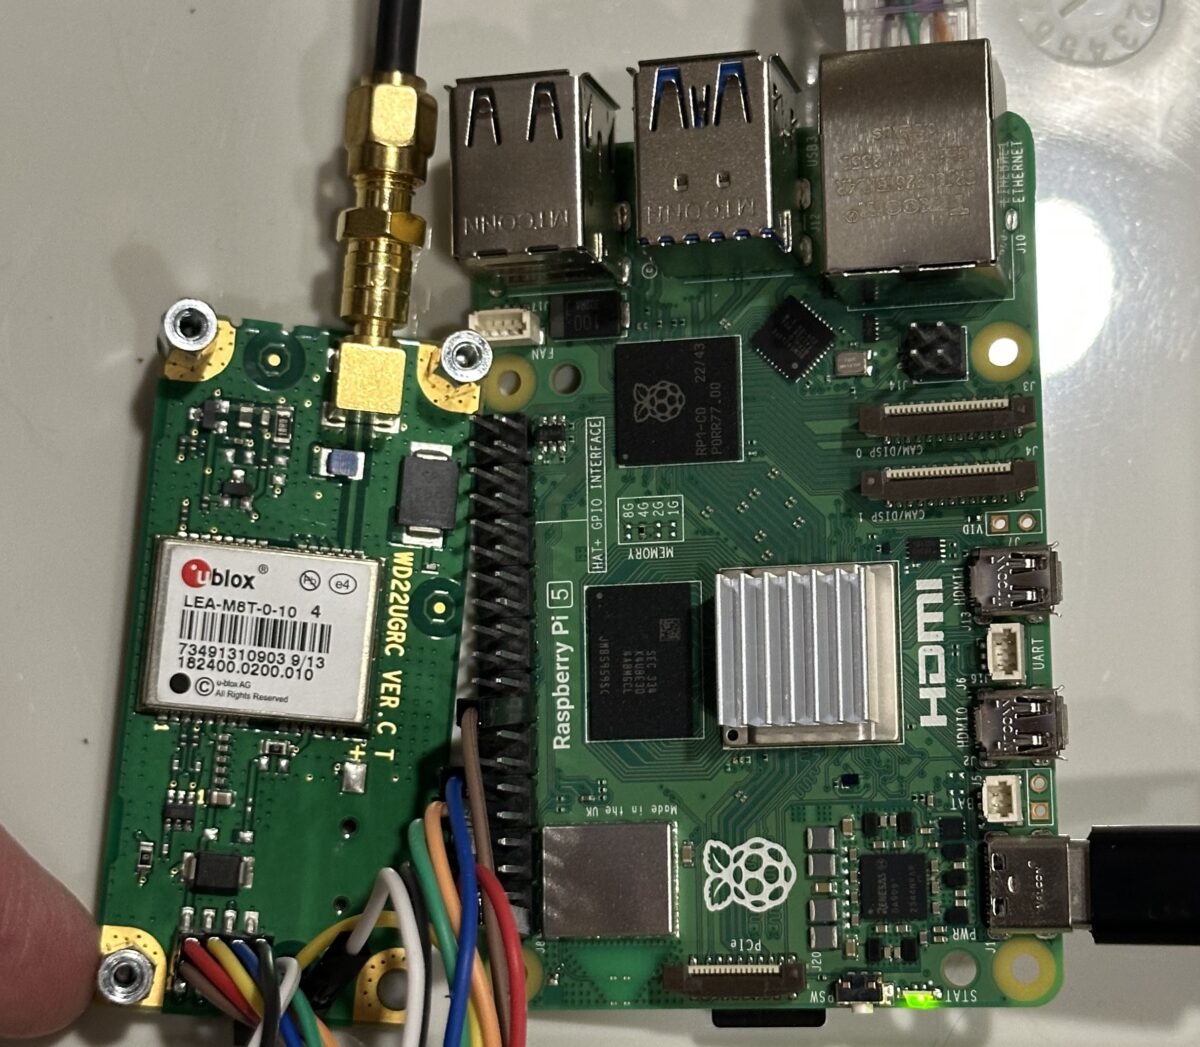
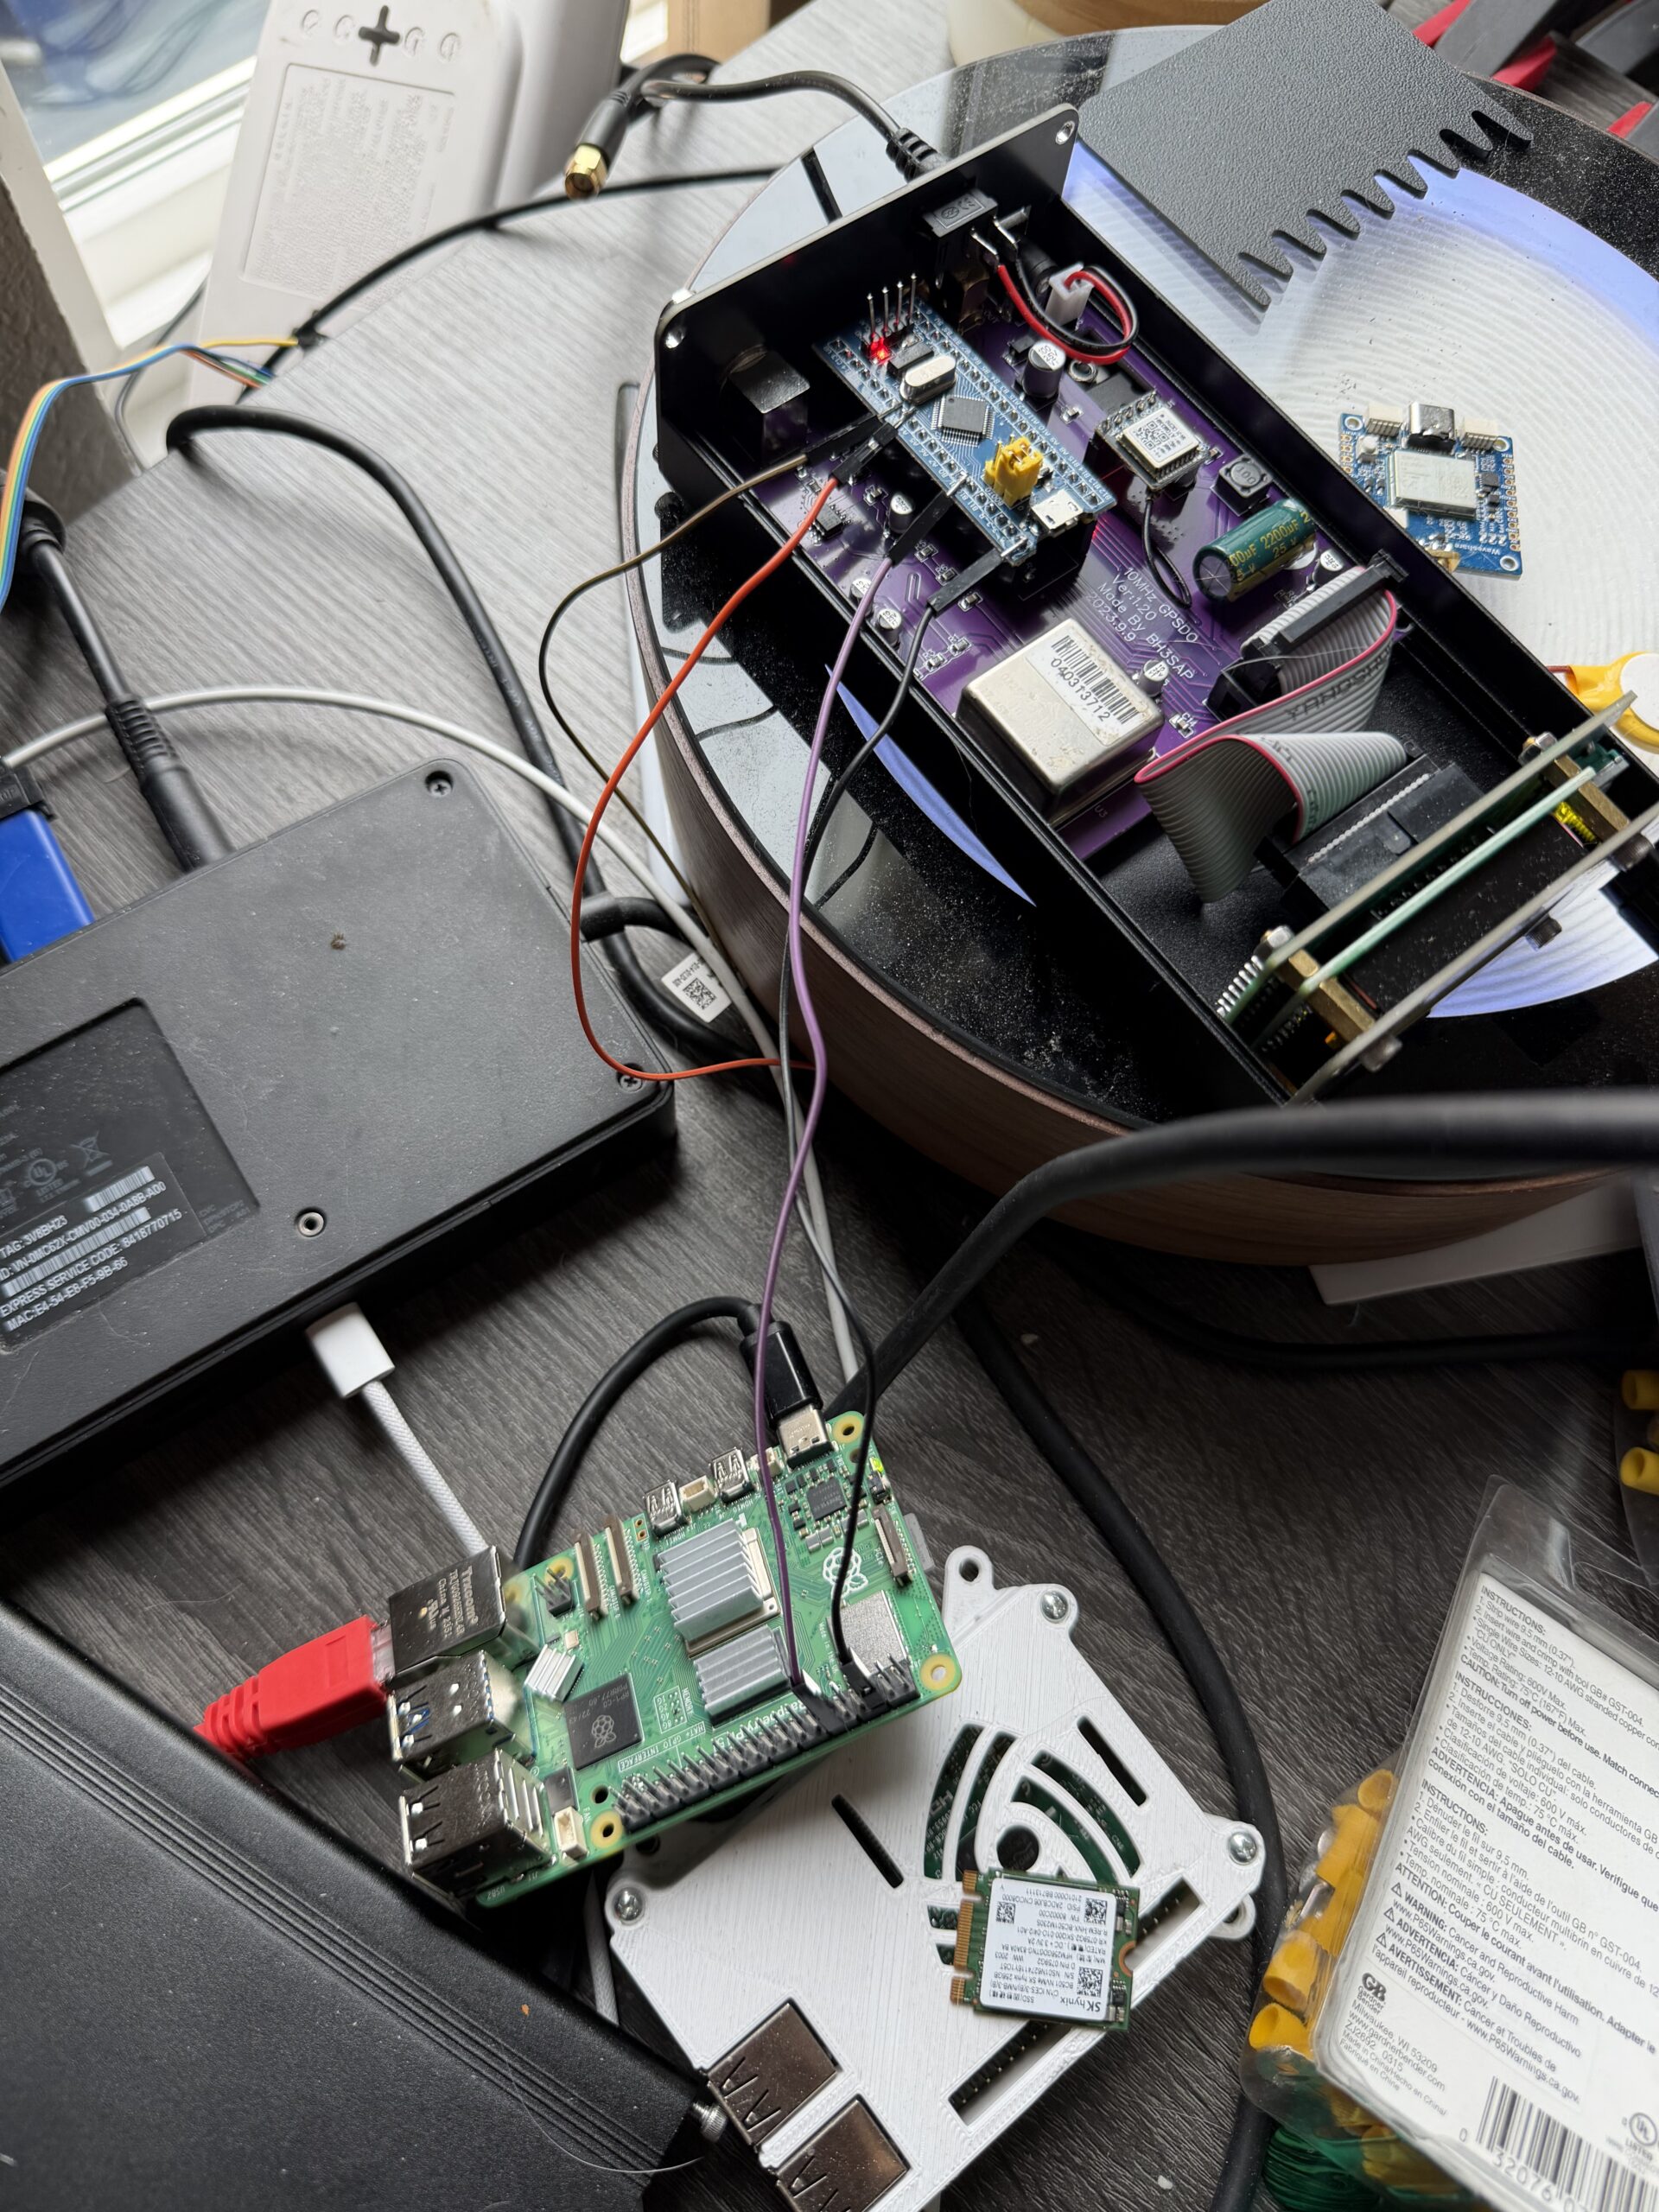
I also have a BH3SAP GPSDO that I picked up for about $70 on eBay – one of those Chinese units with an OX256B OCXO and an STM32 Blue Pill microcontroller. There’s a great thread on EEVBlog about these. I soldered some jumper wires to the MCU PPS output and connected it to GPIO 18 on my Raspberry Pi 5. I’ve been running custom firmware on it (based on fredzo’s gpsdo-fw) with some modifications for telemetry and flywheel display.
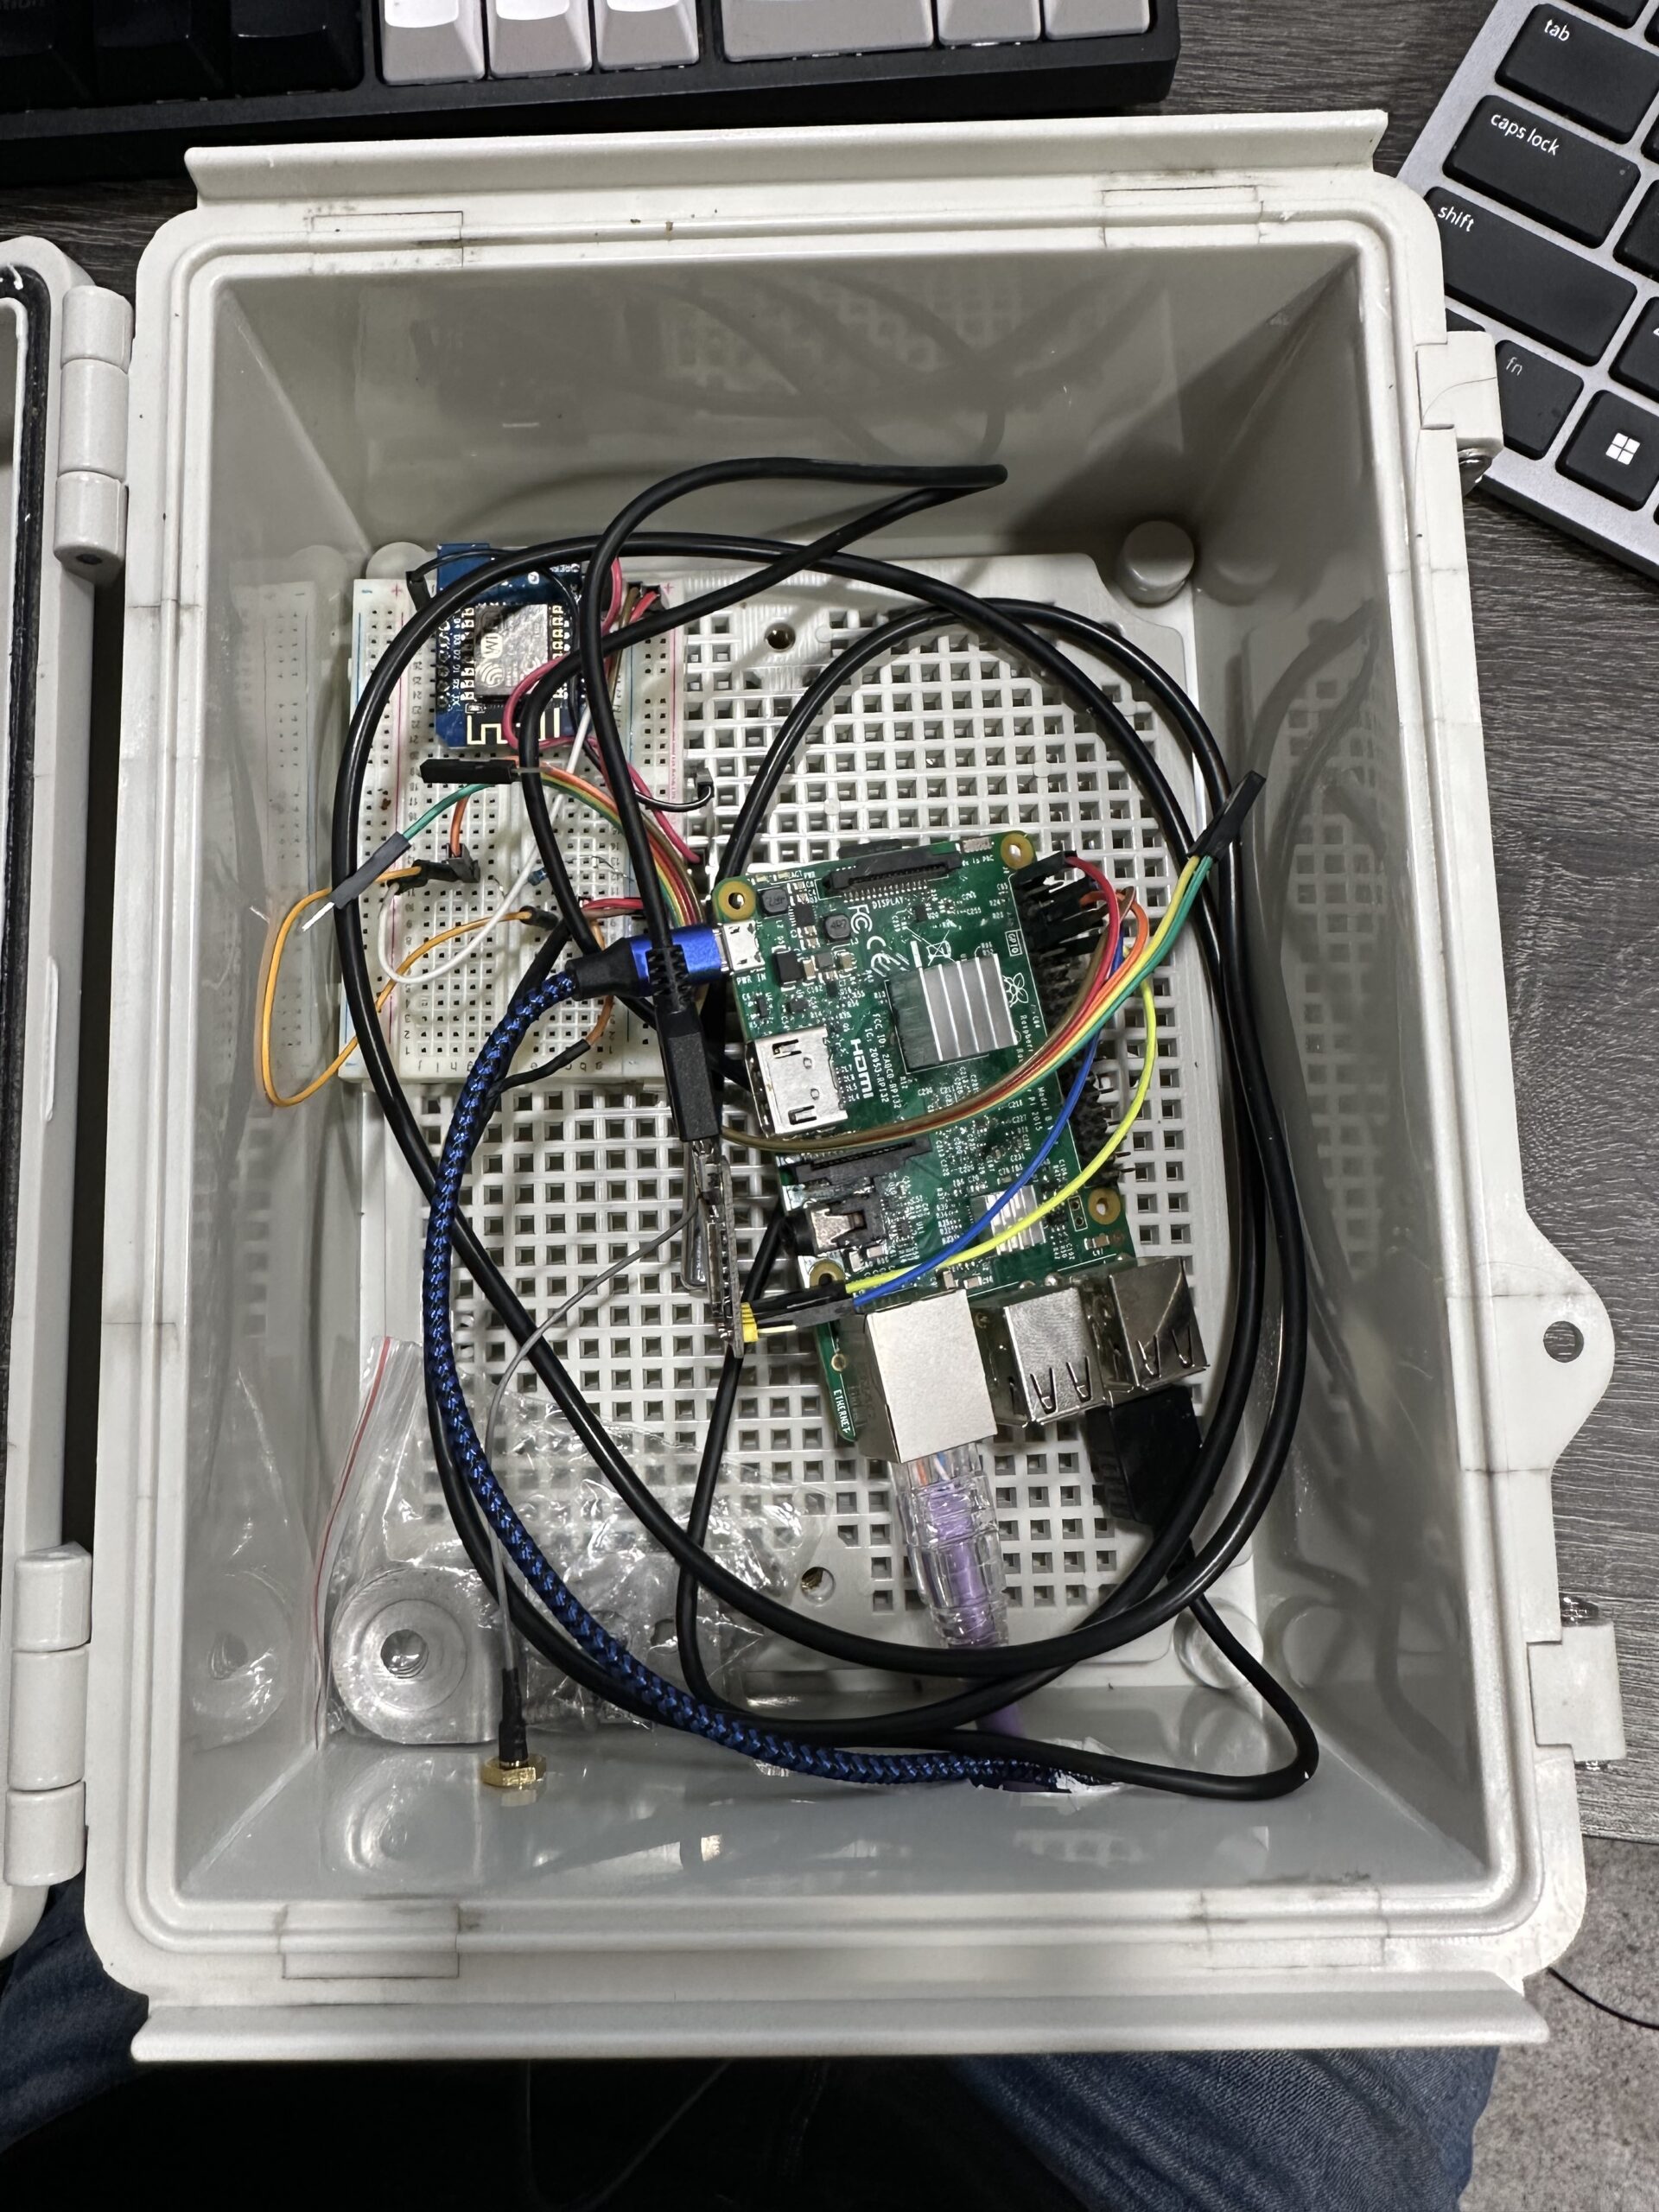
The whole mess wired together – GPSDO PPS jumper wires running to the Pi 5’s GPIO header:
The Raspberry Pi 5 has hardware timestamping on its Ethernet NIC, which gives it a /dev/ptp0 PTP hardware clock (PHC). This is critical – without hardware timestamping, PTP is no better than NTP. The Pi 5’s Ethernet controller supports it natively.
Here’s the setup:
- OSA-5401 ($29) – GPS-disciplined PTP grandmaster, plugged into an SFP port on my network switch
- BH3SAP GPSDO (~$70) – GPS-disciplined OCXO, PPS output wired to Pi 5 GPIO
- Raspberry Pi 5 – running ptp4l (for PTP) and chronyd (for everything else)
- Total cost of timing hardware: ~$100
The Software Stack
The timing chain has two hops:
- ptp4l receives PTP sync messages from the OSA-5401 over Ethernet and disciplines the Pi’s PTP hardware clock (
/dev/ptp0) - chrony reads the hardware clock as a refclock and disciplines the system clock
ptp4l configuration (/etc/linuxptp/ptp4l-osa.conf):
[global]
slaveOnly		1
domainNumber		24
network_transport	L2
time_stamping		hardware
delay_mechanism		E2E
clock_servo		pi
logging_level		6
summary_interval	0

twoStepFlag		1
first_step_threshold	0.00002
step_threshold		0.0
max_frequency		900000000
sanity_freq_limit	200000000

ptp_dst_mac		01:1B:19:00:00:00
p2p_dst_mac		01:80:C2:00:00:0E

[eth0]
The chrony refclock configuration for PTP (/etc/chrony/conf.d/ptp-osa.conf):
# OSA-5401 via ptp4l -> PHC0
# ptp4l disciplines /dev/ptp0 to PTP timescale (TAI)
# tai lets chrony apply the current TAI-UTC offset from its leap second table
refclock PHC /dev/ptp0 refid PTP dpoll -4 poll 0 filter 5 precision 1e-9 tai
A few things worth noting:
taitells chrony the PHC is on TAI timescale and to automatically apply the current TAI-UTC offset (currently 37 seconds). This is better than hardcodingoffset -37because it auto-updates if a leap second is ever announced again.dpoll -4means chrony reads the PHC 16 times per second. I initially had this atdpoll 0(once per second), but a tcpdump revealed the OSA-5401 is actually sending PTP sync messages at 16 Hz, not 1 Hz. So there’s fresh data to read.filter 5takes the median of 5 consecutive reads, rejecting outliers.precision 1e-9tells chrony the refclock is accurate to 1 nanosecond, which tightens the error bounds that chrony uses in source selection.
The Bug: Why Chrony Refused to Use the Better Source
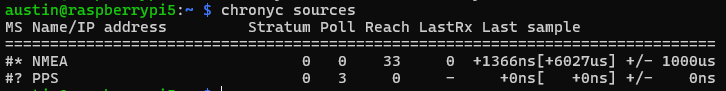
When I first got this all running, I had both PPS (from the GPSDO) and PTP (from the OSA-5401) configured as refclocks. The GPSDO had lost GPS lock overnight and had been flywheeling for about 12 hours. PTP was clearly the better source – lower jitter, independent GPS reference. But chrony stubbornly stayed on PPS.
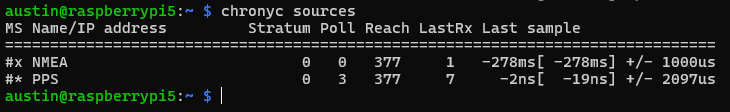
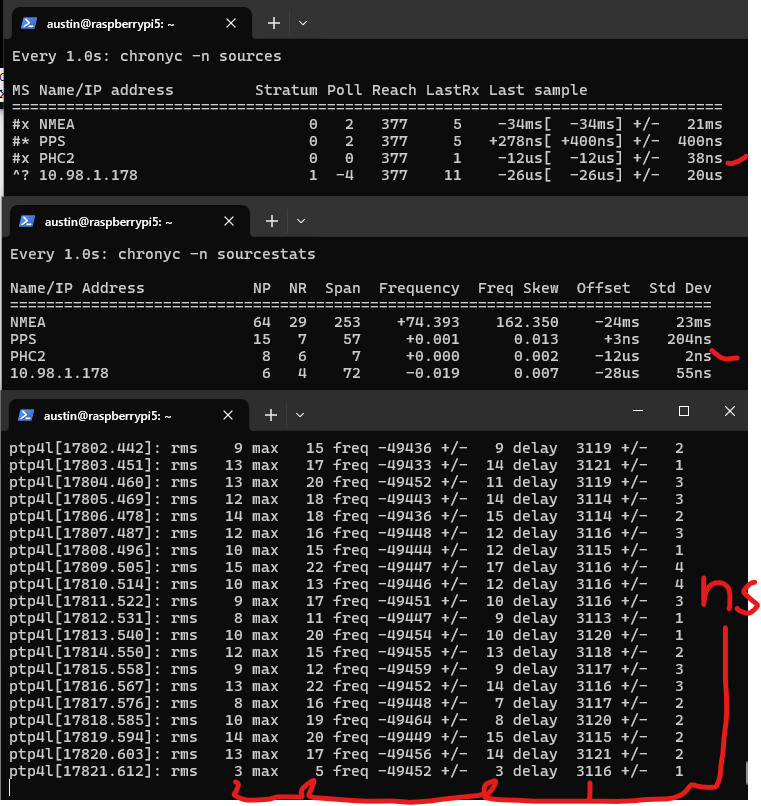
Here’s what chronyc sources showed:
MS Name/IP address         Stratum Poll Reach LastRx Last sample
===============================================================================
#* PPS                           0   2   377     5   -114ns[ -132ns] +/-  101ns
#x PTP                           0   2   377     3    -59us[  -59us] +/-  101ns
PPS was selected (*) and PTP was marked x – “may be in error.” But PTP wasn’t in error. The GPSDO had drifted 59 microseconds during 12 hours of flywheel, and chrony was faithfully following it off a cliff.
The culprit was in the PPS refclock config:
refclock PPS /dev/pps0 refid PPS dpoll 0 poll 2 filter 3 precision 1e-7 prefer trustThat trust flag is nuclear. It tells chrony: “this source is always correct – never classify it as a falseticker.” Combined with prefer, chrony would choose PPS no matter how much every other source disagreed with it. Three sources (PTP, pi-ntp, pfsense) all agreed the system clock was off by ~59 μs, but chrony trusted PPS absolutely and marked PTP as suspicious instead.
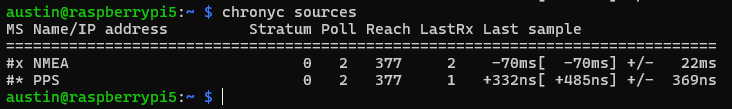
The fix was simple: remove trust. And after some more testing, remove prefer too. Let chrony’s selection algorithm do its job. As soon as I did that:
MS Name/IP address         Stratum Poll Reach LastRx Last sample
===============================================================================
#- PPS                           0   2    17     1    +59us[  +59us] +/-  101ns
#* PTP                           0   2    37     2    +22ns[  -83ns] +/-   18ns
PTP immediately took over. PPS correctly demoted to - (valid but not selected), showing +59 μs offset – the accumulated GPSDO flywheel drift.
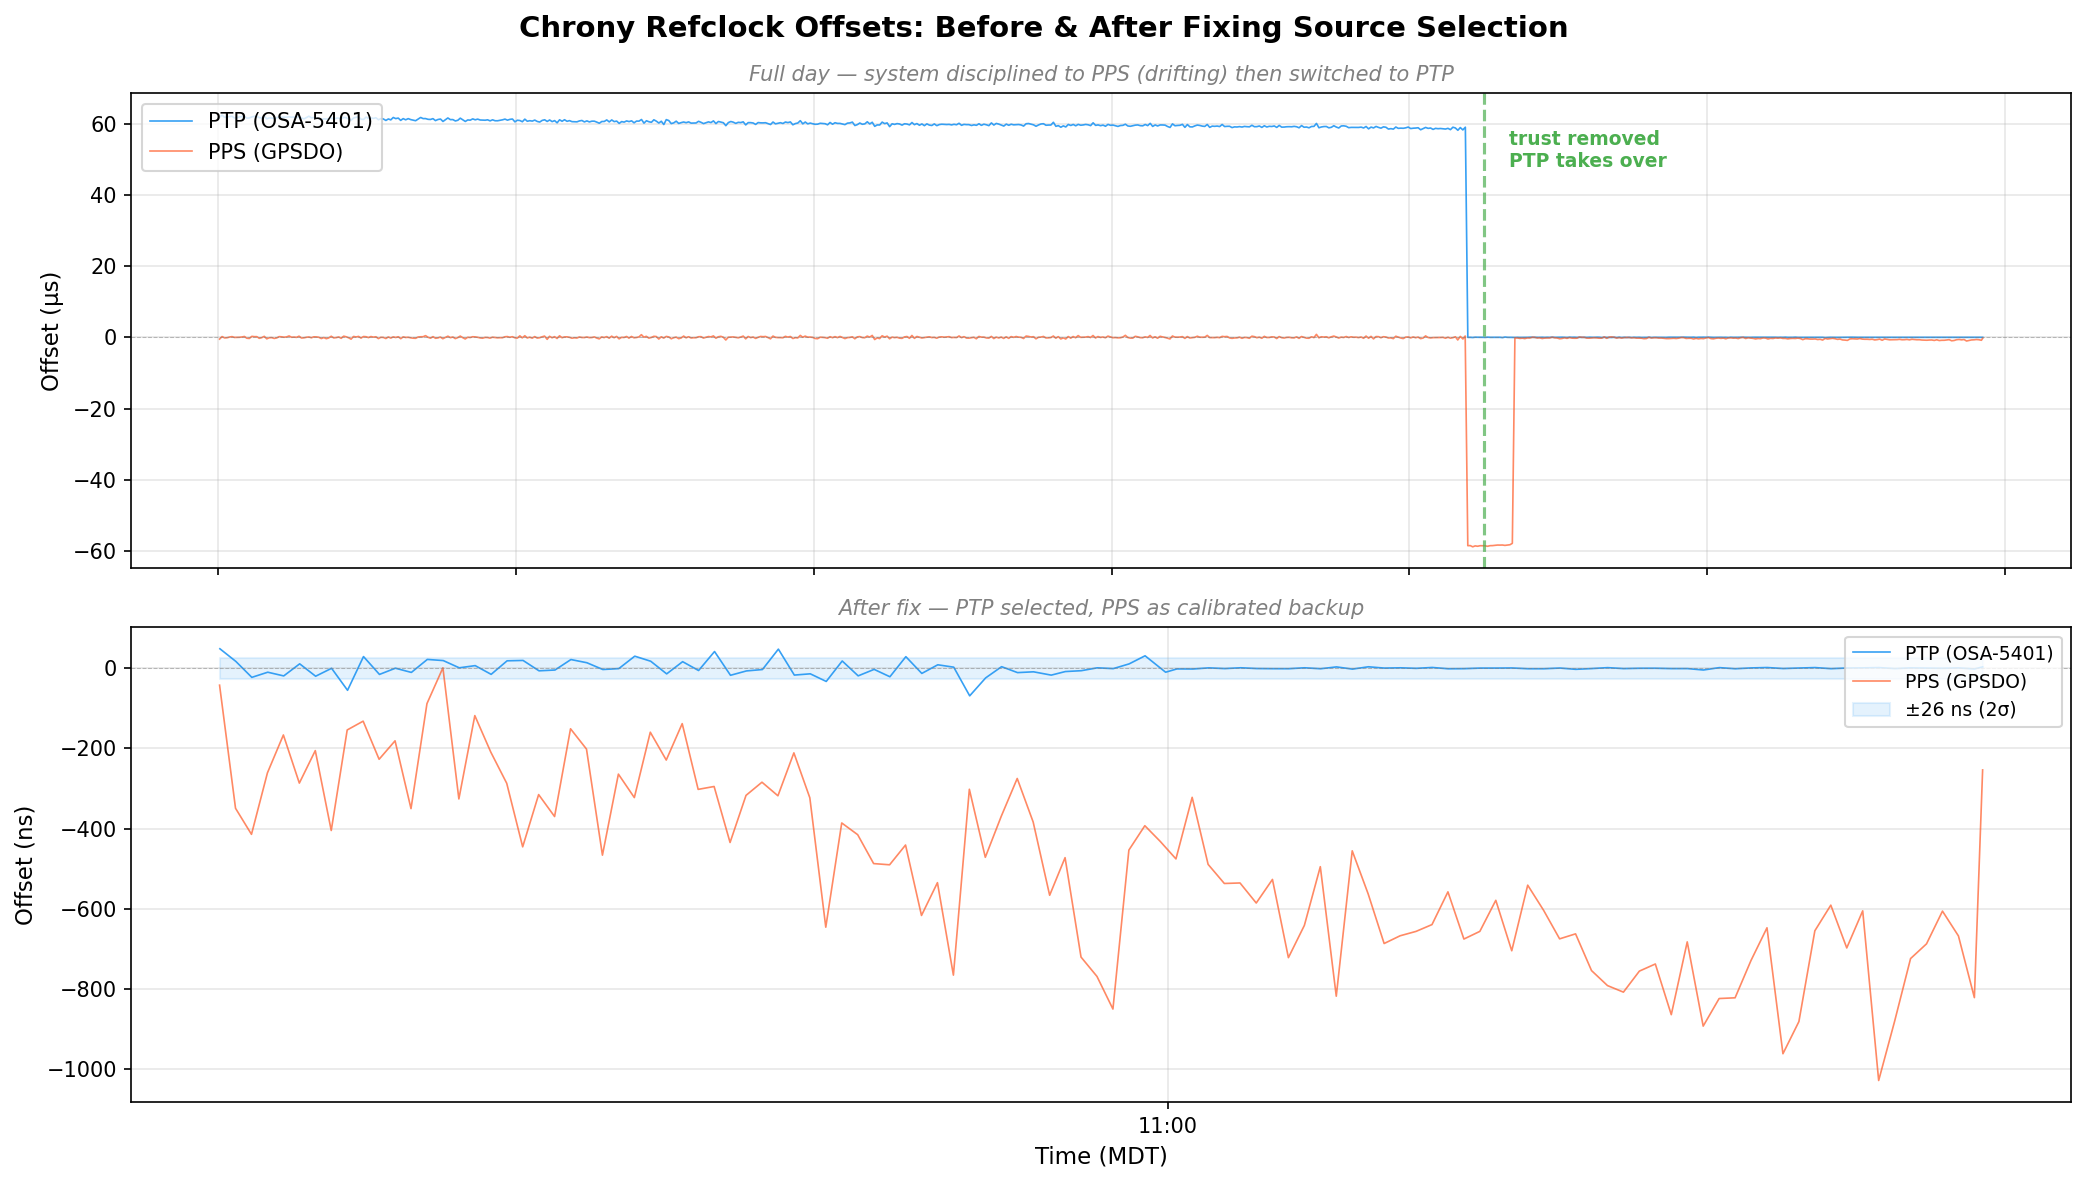
Here’s the full day of refclock data. The top panel is in microseconds – you can see PTP sitting at +60 μs the whole morning because the system clock was following the drifting GPSDO. Then the fix lands around 08:30 MDT and everything snaps into place. The bottom panel zooms into the post-fix period in nanoseconds:
Discovering the 58.3 Microsecond MCU Bias
Once the GPSDO regained GPS lock, I expected PPS to converge back toward PTP. It didn’t. It settled at a rock-solid +58 μs offset with 474 ns standard deviation. Locked, stable, just… late.
The BH3SAP GPSDO doesn’t pass the GPS module’s PPS signal directly to the output. It goes through the STM32 microcontroller – GPIO interrupt, some processing, then the MCU asserts the output pin. And traverses a jumper wire with questionable soldering. That path adds latency (and a not very clean edge). With PTP as ground truth, I could now measure exactly how much.
I pulled 500 samples from chrony’s refclock log and crunched the numbers:
| Stat | Value |
|---|---|
| Mean | -58.319 μs |
| Median | -58.372 μs |
| Std Dev | 787 ns |
| P5–P95 | -59.2 to -57.4 μs |
| Range | 9.8 μs peak-to-peak |
A consistent 58.3 microsecond delay. Sub-microsecond jitter – the MCU interrupt path is deterministic, just slow. The fix is a static offset in the chrony config:
refclock PPS /dev/pps0 refid PPS dpoll 0 poll 2 filter 3 precision 1e-7 offset 0.0000583After applying the offset and restarting chrony:
MS Name/IP address         Stratum Poll Reach LastRx Last sample
===============================================================================
#- PPS                           0   2    37     4   +425ns[ +423ns] +/-  101ns
#* PTP                           0   2    77     4    -24ns[  -26ns] +/-   18ns
PPS went from +58 μs to +425 ns. The two sources now agree to within a microsecond, and PPS is a legitimate backup if PTP ever drops.
The Results: ±26 Nanoseconds
After tuning the PTP refclock parameters (dpoll -4, poll 0, filter 5), here are the final numbers:
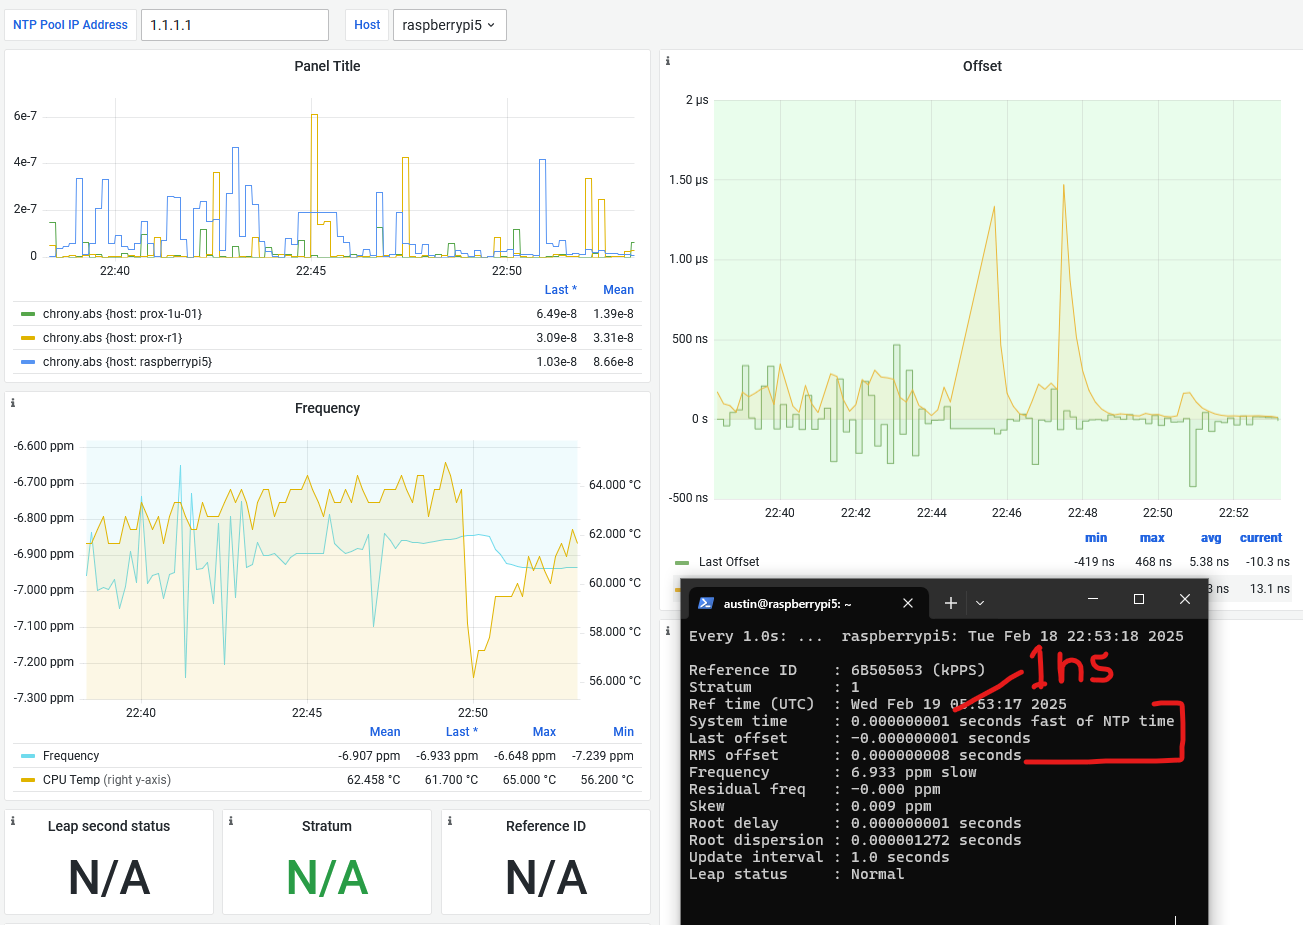
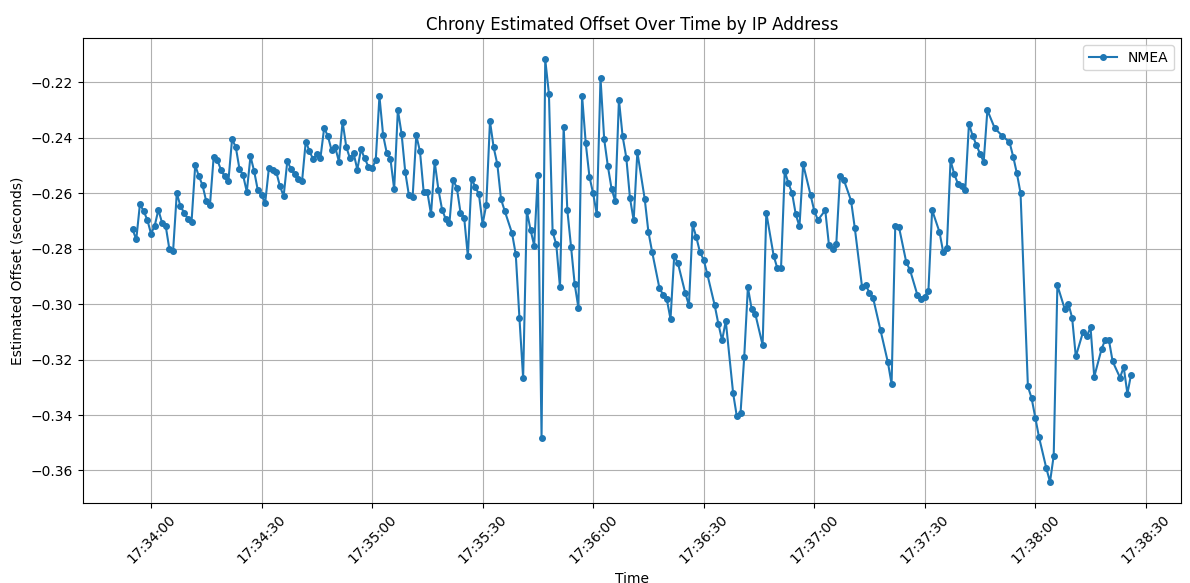
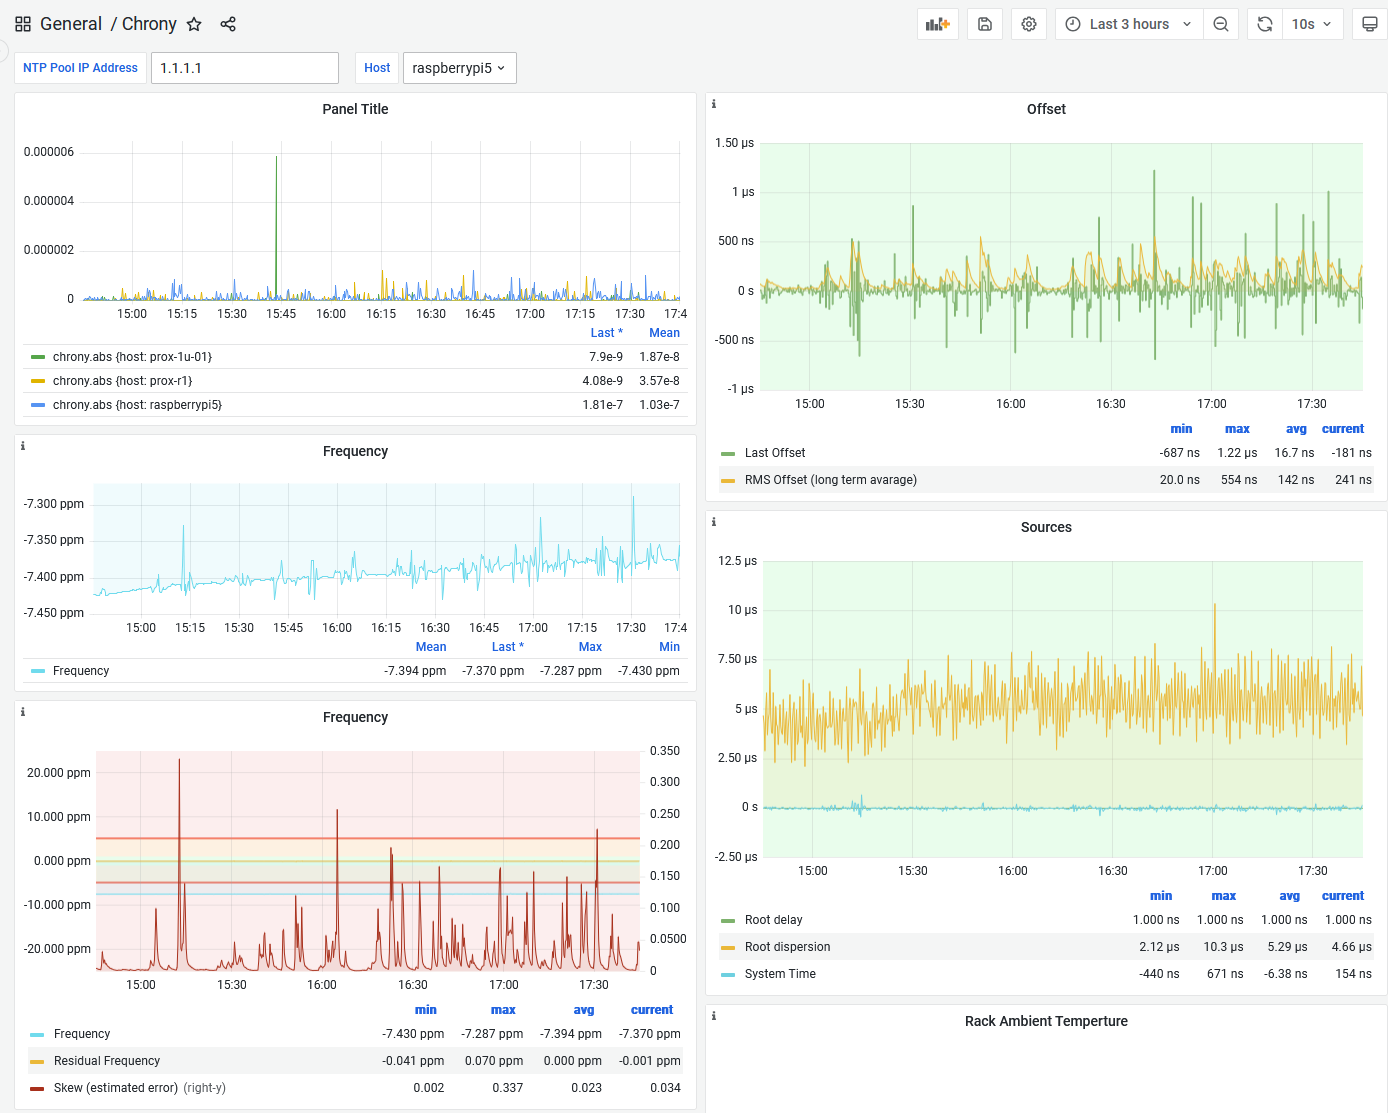
But first, here’s the big picture. This is 36 hours of chrony’s tracking offset – the actual error between the system clock and whatever reference chrony was using at the time:
The orange scatter is the GPSDO’s PPS running chrony for a day and a half – ±200 ns on a good minute, ±400 ns on a bad one. The green dashed line is the moment I removed trust and PTP took over. The purple line is when I cranked the polling rate to 16 Hz. After that, the data is a flat line at zero on this scale.
ptp4l (OSA-5401 → Pi hardware clock):
| Metric | Value |
|---|---|
| RMS offset | 11.8 ns |
| Max offset | 17 ns |
| Path delay | 3,160 ns |
chrony (Pi hardware clock → system clock):
| Metric | Value |
|---|---|
| Std Dev | 5 ns |
| RMS offset | 4 ns |
| Frequency skew | 0.002 ppm |
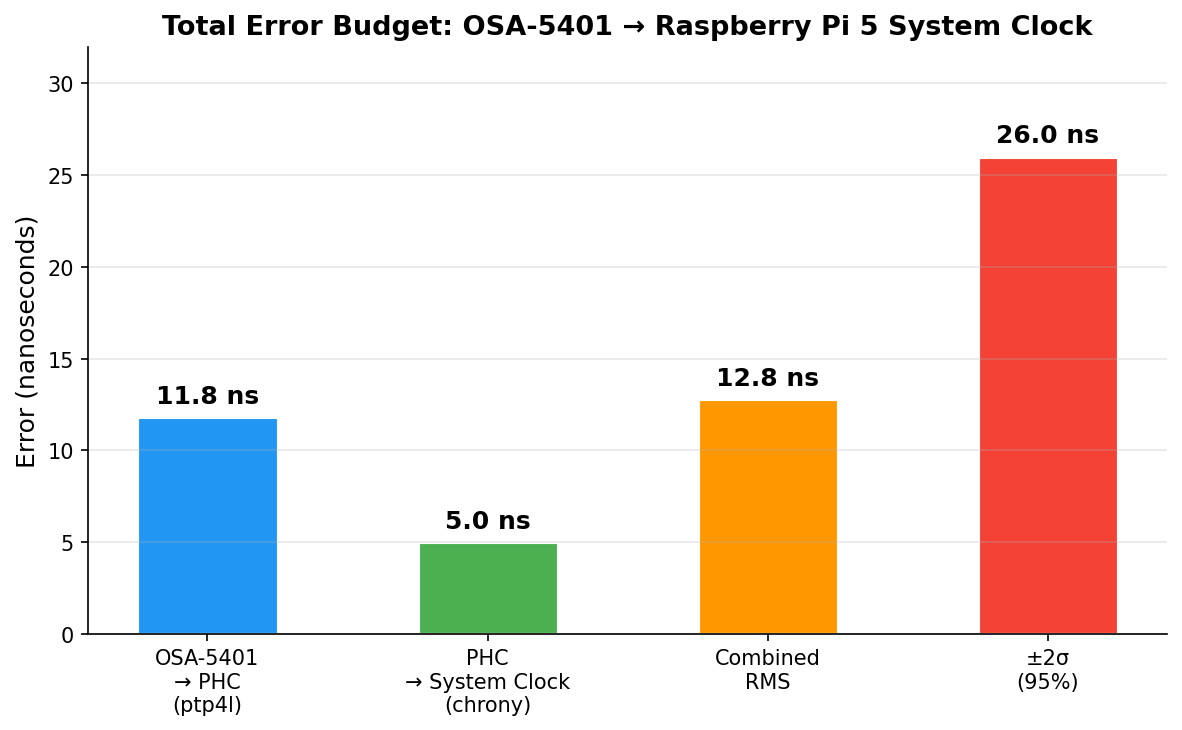
Combined error budget (root sum of squares):
| Layer | Error |
|---|---|
| OSA-5401 → PHC (ptp4l) | 11.8 ns |
| PHC → system clock (chrony) | 5.0 ns |
| Combined RMS | 12.8 ns |
| ±2σ (95% confidence) | ±26 ns |
For comparison, my Pi 3B NTP server that’s been running for years:
| Metric | Pi 3B (GPS PPS + NTP) | Pi 5 (PTP + OSA-5401) |
|---|---|---|
| RMS offset | 182 ns | 4 ns |
| Std Dev | 312 ns | 5 ns |
| 2σ bound | ~±600 ns | ±26 ns |
| Improvement | baseline | ~45x better |
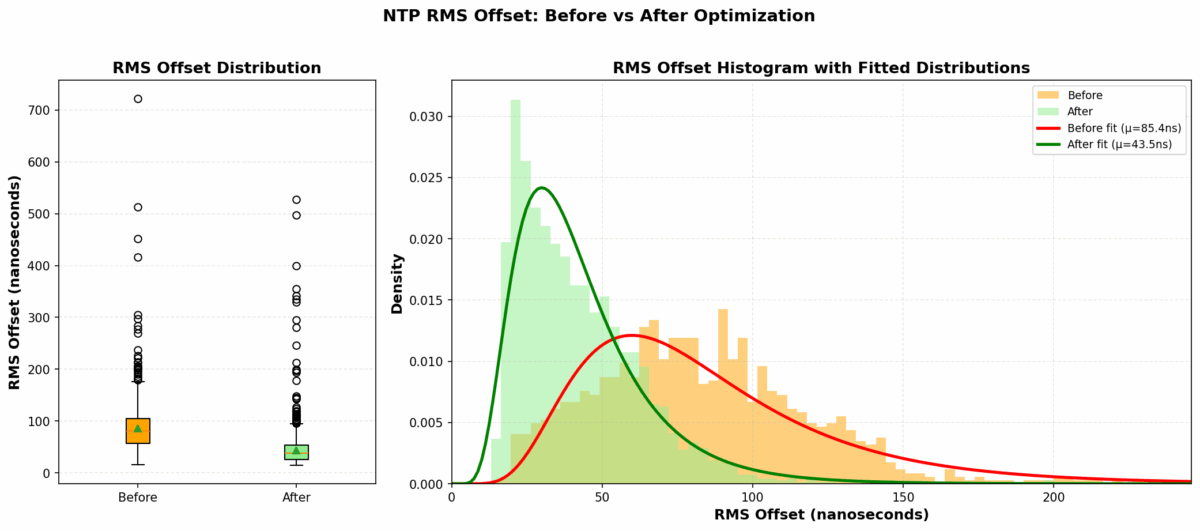
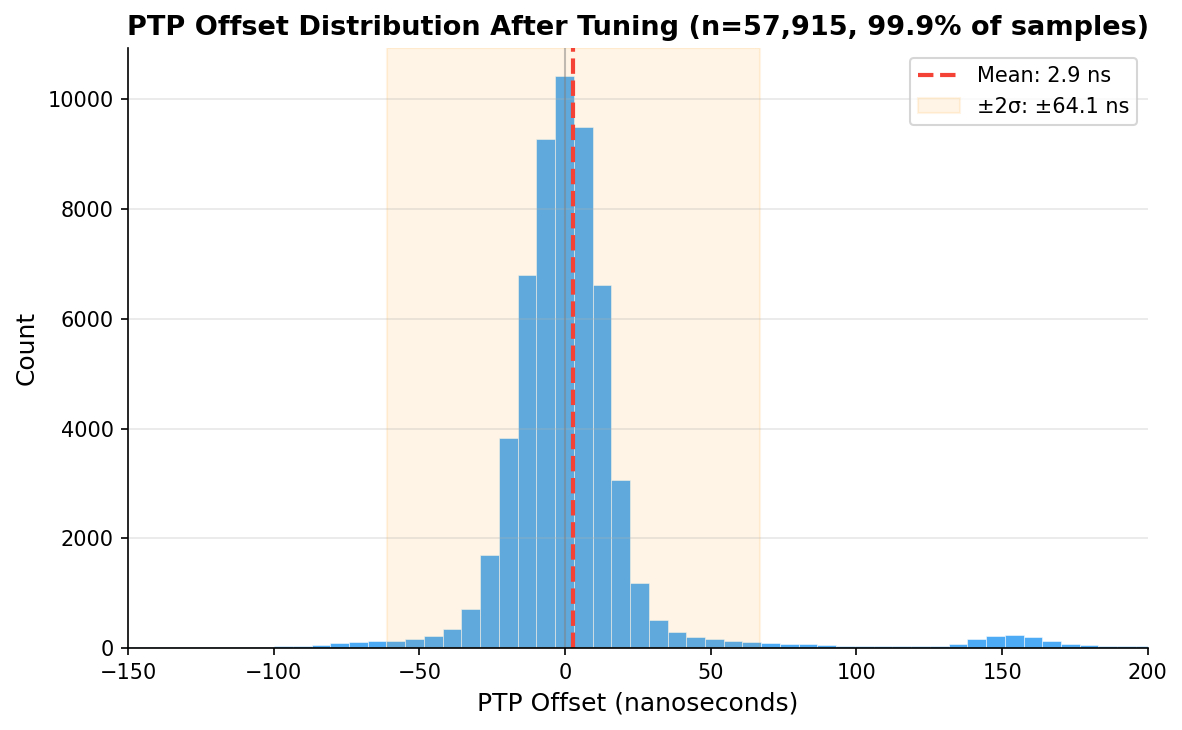
And here’s the distribution of 57,915 PTP offset samples after tuning. Mean of 2.9 ns, tight Gaussian centered right on zero:
Checking Our Work: What Does the Raw Data Actually Say?
Those numbers above come from what the servos report. ptp4l prints a 1 Hz RMS summary. chrony’s sourcestats shows the standard deviation of its filtered, averaged output. Both are honest numbers, but they’re the numbers after each servo has done its best to smooth things out. What does the raw measurement data look like?
I pulled 110 minutes of overlapping data – ptp4l’s 1 Hz journal summaries and chrony’s 16 Hz raw refclock offset log – and computed 1-minute rolling statistics for each layer, then combined them as root sum of squares:
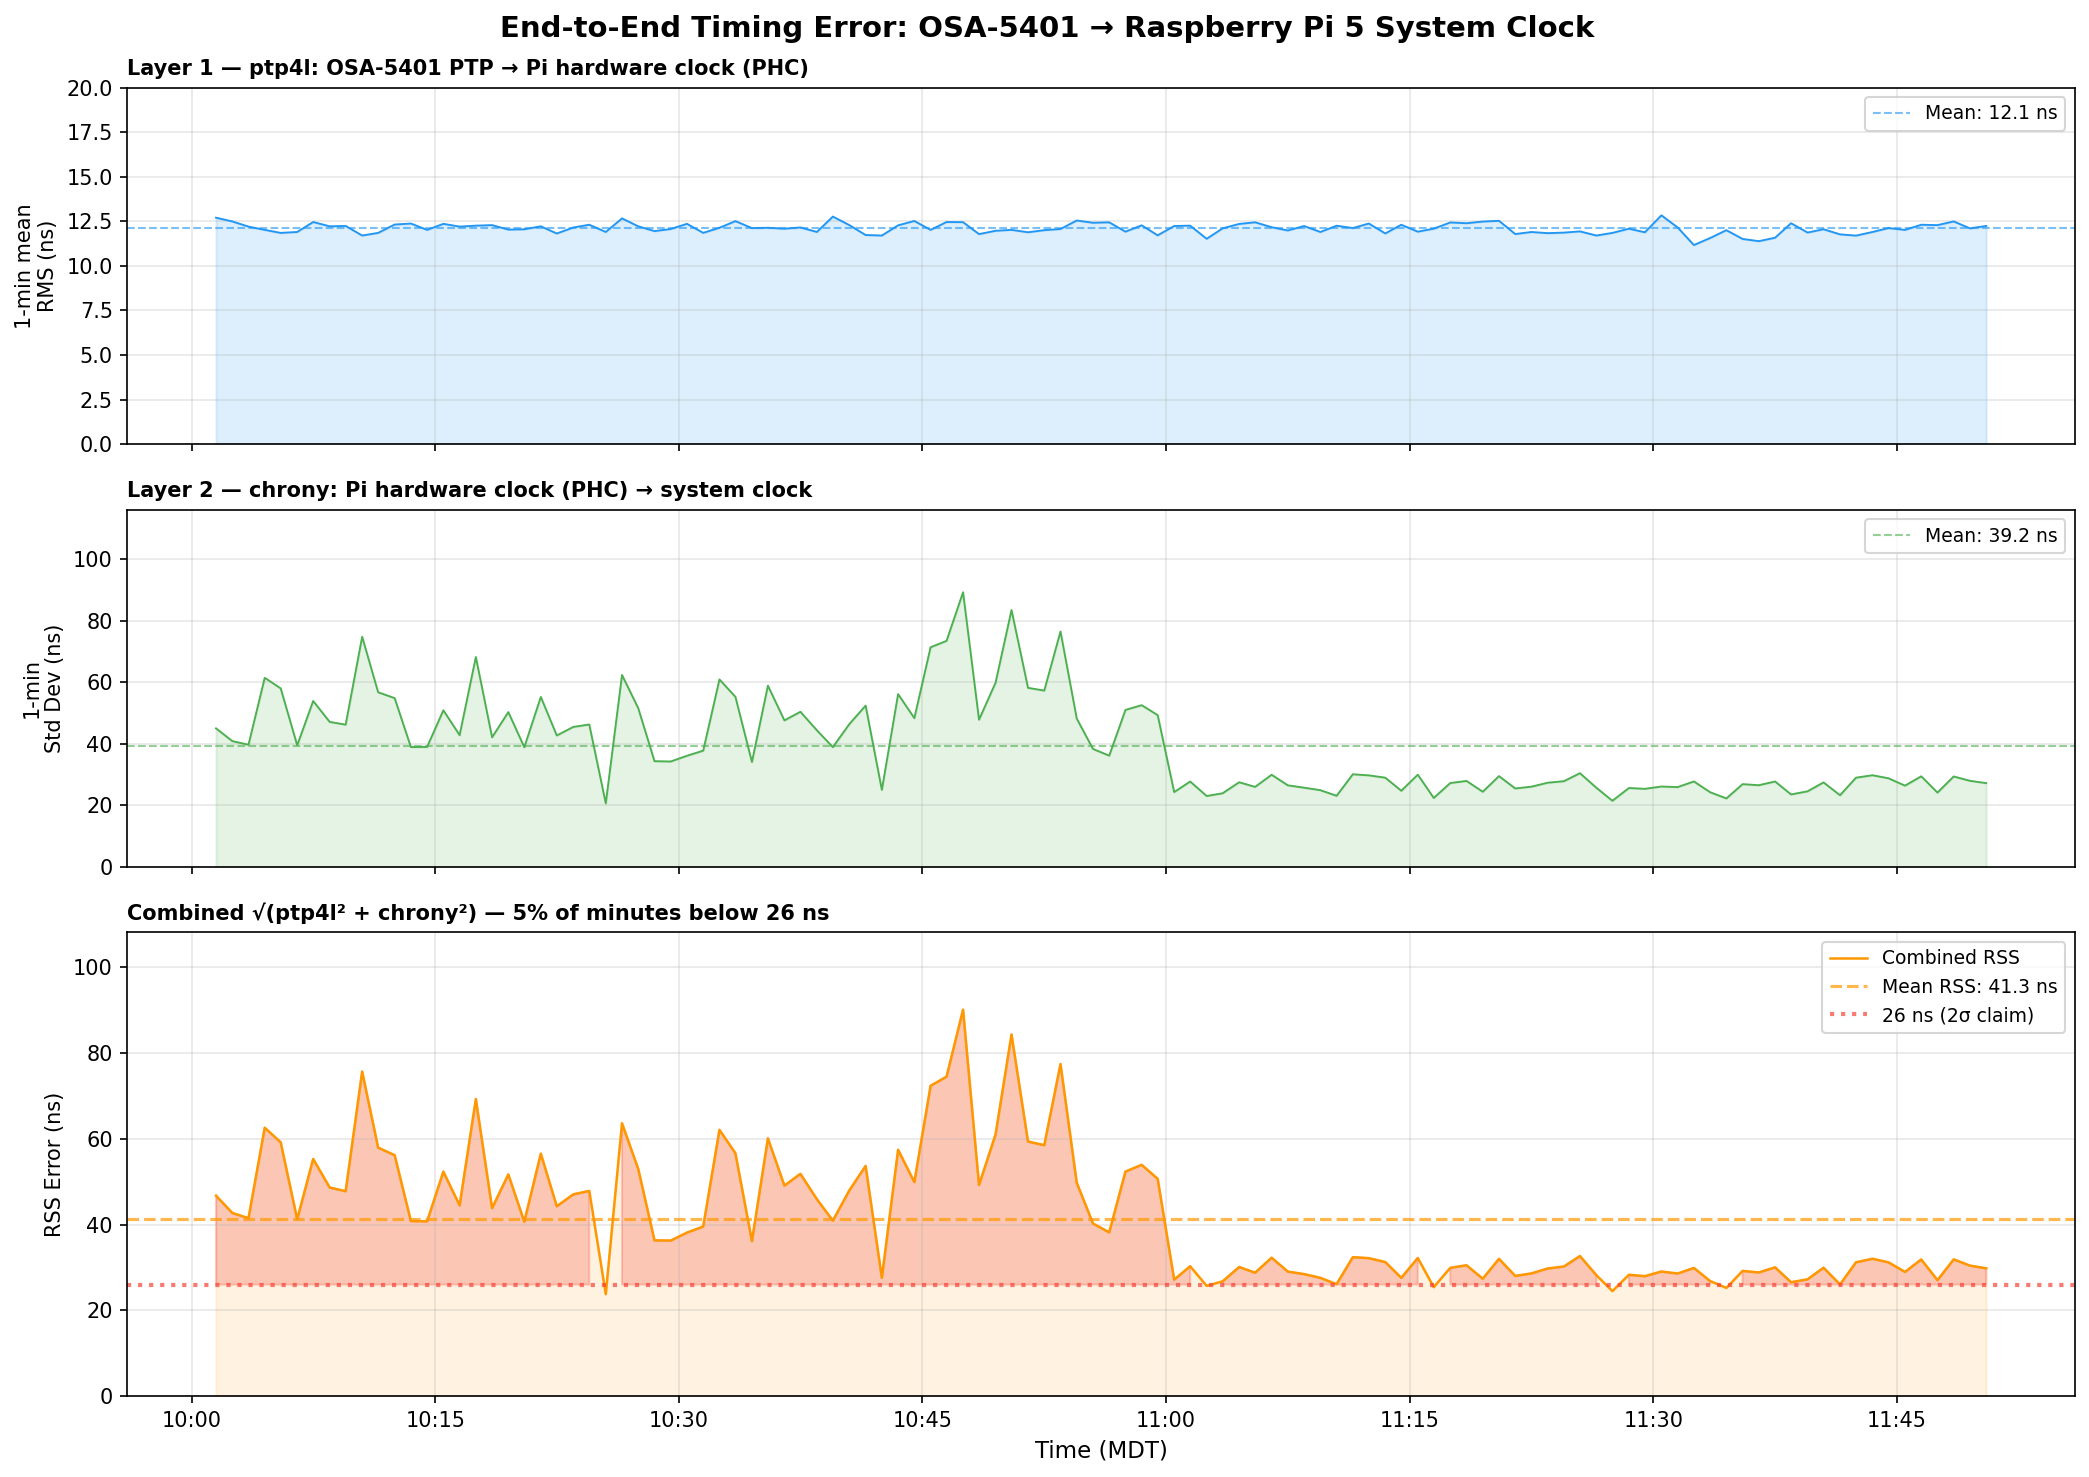
Three things jump out:
ptp4l is the stable one. Layer 1 (OSA-5401 → PHC) sits at 12.1 ns mean RMS and barely moves. The FPGA doing the hardware timestamping in the OSA-5401 earns its keep here – there’s just not much noise to begin with.
chrony’s raw readings are noisier than its filtered output suggests. The 16 Hz PHC reads have a 39 ns mean standard deviation per minute, with spikes up to 90 ns. But chrony’s sourcestats reports 5 ns – because the median-of-5 filter and the PI servo smooth that out before it touches the system clock. Both numbers are real; they measure different things.
The honest combined number is ±40–50 ns typical, not ±26 ns. The ±26 ns figure from chrony’s tracking output reflects the post-filter error – what the system clock actually experiences after chrony has done its smoothing. The raw measurement chain has more jitter than that. You can see the combined RSS settling toward 27–30 ns in the last hour as the servo tightened, but 40 ns is a fairer typical value.
Even at ±50 ns, that’s still 4× better than the Pi 3B’s ±200 ns. And the trend in the last hour suggests it keeps improving as chrony accumulates more data and tightens its frequency estimate.
GPSDO Flywheel Testing
With the PTP source providing a known-good reference, I can now characterize the GPSDO’s holdover performance. I unplugged the GPSDO’s GPS antenna and let it flywheel on its OCXO. Early results after the first hour showed drift still buried in the noise floor – under 100 ns/hr. The OX256B OCXO in this $70 unit might actually be decent. I’m collecting data for a longer run and will update this post (or write a follow-up) with the full holdover curve.
The dream setup is adding a DS18B20 temperature sensor directly to the OCXO case so I can correlate thermal drift with the oscillator’s frequency offset. That would let me separate temperature-driven drift from aging – but that’s a project for another weekend.
The Journey: Five Years, Six Orders of Magnitude
| Year | Post | Method | Accuracy |
|---|---|---|---|
| 2021 | USB GPS NTP | NTP over USB serial | ~1 ms |
| 2021 | GPS PPS NTP | GPIO PPS + chrony | ~1 μs |
| 2025 | Revisiting in 2025 | Tuned chrony + Pi 3B | ~200 ns |
| 2025 | Thermal management | CPU temp stabilization | ~86→16 ns RMS |
| 2026 | This post | PTP + OSA-5401 | ±26 ns |
From a $12 USB GPS dongle to a $29 telecom SFP module. From milliseconds to nanoseconds. The total cost of the timing hardware in my current setup is about $100, and it’s achieving accuracy that used to require five-figure test equipment.
The next step down would be sub-nanosecond, and that requires White Rabbit – dedicated hardware, specialized SFP transceivers, and budgets measured in tens of thousands. For commodity Ethernet and general-purpose Linux, ±26 nanoseconds is pretty much the floor.
I think I’m done. (For now.) At least, that’s what I told my wife.
Configs for Reference
PTP refclock (/etc/chrony/conf.d/ptp-osa.conf)
# OSA-5401 via ptp4l -> PHC0
# ptp4l disciplines /dev/ptp0 to PTP timescale (TAI)
# tai lets chrony apply the current TAI-UTC offset from its leap second table
refclock PHC /dev/ptp0 refid PTP dpoll -4 poll 0 filter 5 precision 1e-9 tai
PPS refclock (/etc/chrony/conf.d/pps-gpsdo.conf)
# GPSDO 1 Hz PPS on GPIO 18
# dpoll 0 = read every pulse (1 Hz)
# filter 3 = median of 3 samples (odd count for true median)
# poll 2 = 4s loop update (2^2=4 >= filter 3)
# offset = MCU PPS delay compensation (58.3us measured against PTP)
refclock PPS /dev/pps0 refid PPS dpoll 0 poll 2 filter 3 precision 1e-7 offset 0.0000583

# Accurate LAN NTP server - coarse time for PPS second identification
server 10.98.1.198 iburst minpoll 4 maxpoll 6
ptp4l service
/usr/sbin/ptp4l -f /etc/linuxptp/ptp4l-osa.conf -i eth0chrony main config highlights
log tracking measurements statistics refclocks
maxupdateskew 0.1
rtcsync
makestep 1 -1
leapsectz right/UTC
hwtimestamp *
The hwtimestamp * line enables hardware timestamping on all interfaces, and leapsectz right/UTC is required for the tai refclock option to work correctly.
Disclosure: When you click on links to various merchants in this post and make a purchase, this can result in this site earning a commission. Affiliate programs and affiliations include, but are not limited to, the eBay Partner Network.