Categories
AI homelab Programming Python

Building DIMMsum: a price tracker for used server RAM on eBay

This project exists because I bought 30 sticks of 16GB DDR4-3200 RDIMM for an EPYC build in early April: an r/homelabsales find at $80 a stick, which was a fair price that day. The problem is that “that day” turned out to be the exact top of the market. Buying the top is pretty standard for me. Then the server wouldn’t POST with at least 4 of the sticks installed, and of the 16 that made it in, 4 more start throwing ECC errors the moment I do anything memory-heavy (LLM inferencing, which is of course why I bought them). There are still 6 untested sticks in the box. I knew the going rate; what I couldn’t see was where prices were headed or which sticks would actually work. A price tracker with real sold history fixes at least the first problem.

Beyond my own bad luck, the general problem is that eBay search results for server RAM are a mess. “32GB (2x16GB)” is two 16GB sticks, not one 32GB stick. The same 2666 MT/s speed shows up as DDR4-2666, PC4-21300, PC4-2666V, or just “2666V” depending on the seller’s mood. Lots of 8, lots of 32, single sticks, and “FOR PARTS” boards are all mixed together in the same results. Comparing actual price per gigabyte across all of that by hand is miserable.

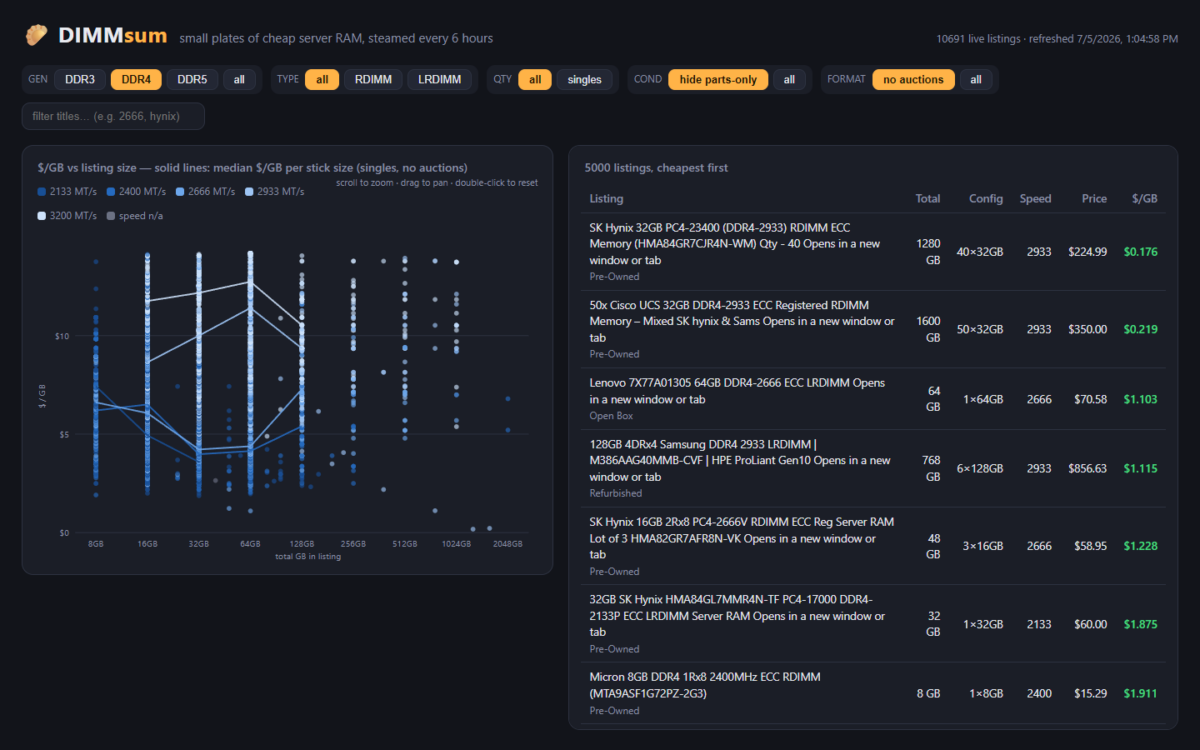
LabGopher solved this years ago for whole servers, and I have wanted the RAM equivalent basically forever. So I built it: DIMMsum, a free site that scrapes eBay every 6 hours, normalizes the listing titles with an LLM, and charts everything as $/GB with median market lines per speed grade.

Welcome to Austin’s Nerdy Things, where we deploy a browser farm and a language model to avoid doing mental math on eBay listings.
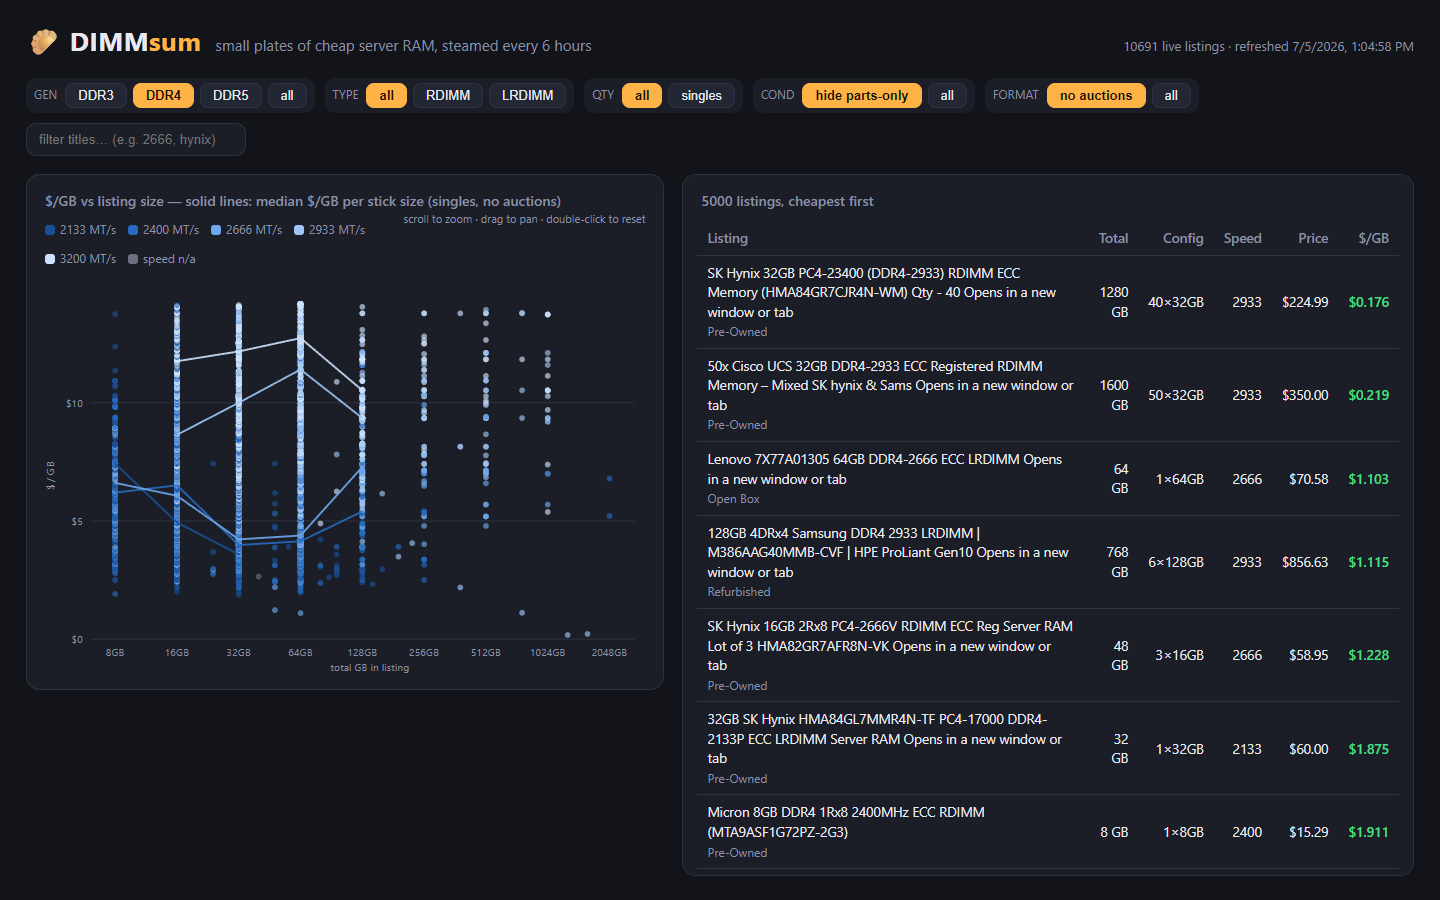
DIMMsum homepage: $/GB scatter of live eBay listings colored by speed, with median market lines and the cheapest-first table

My first attempt (2024) was bad

This is actually my second run at scraping eBay. Back in 2024 I wrote a requests + BeautifulSoup scraper that pulled search results through free SOCKS proxies from public proxy lists. It mostly worked, in the sense that it is technically still running on an LXC in my basement, appending to a parse.log that is now 636MB. The proxies were garbage (free proxies are free for a reason), the regex title parsing was wrong constantly, and I never did anything with the data. Classic.

Two things changed since then: eBay got much more aggressive about blocking scrapers, and LLMs got cheap enough to throw at every single listing title. Both of those turned out to matter a lot.

eBay does not want to be scraped (by robots that look like robots)

The 2024 approach is completely dead in 2026. Plain HTTP clients like requests do not even get to say hello anymore – eBay identifies them as robots essentially instantly and serves a 403 or the “Pardon Our Interruption” page. My first attempts with an automated browser got generic eBay error pages on search URLs too, while the exact same URLs worked fine by hand. That one had me confused for a while.

I am going to spare you the play-by-play here, partly because it would be a bot-evasion cookbook published by a site that participates in eBay’s own affiliate program, which seems unwise. The short version: the fix was embarrassingly simple, and it amounted to using a real browser (Playwright driving full Chromium) and having it behave like a polite human instead of a robot in a hurry. Take the path a person would take, slow down, keep the footprint small. No proxies, no stealth plugins, one IP, 3-6 second randomized delays between pages, and eBay has been perfectly happy serving me 240 listings per page ever since – a few hundred page loads a day, total.

The query matrix (or: making the search do half the parsing)

Instead of one broad “ddr4 rdimm” search, DIMMsum runs 51 very specific queries, one per capacity + speed + module type combo:

32gb (2666,pc4-21300,2666v) rdimm -2x16 -4x8 -8x4

The parenthesized part is eBay OR syntax covering the speed synonyms, and the negative terms exclude kit notation so results skew toward true single sticks. The neat part is that each query doubles as a weak label: if a listing was found by the 32GB 2666 RDIMM query but parses out as a 16GB stick, something is off (a lot, a mislabel, or a parse bug), and it gets flagged with a little warning icon in the UI instead of silently polluting the chart.

LLM title parsing for $0.09 per thousand listings

Here is a real title from the database:

2048GB 128x16GB DDR3 PC3L-10600R ECC Reg Server Memory RAM

That is 128 sticks of 16GB low-voltage DDR3-1333 RDIMM. My 2024 regex parser had no chance. The domain rules are genuinely fiddly: a PC3L prefix means low voltage, but a trailing L on the PC number (PC3-14900L) means LRDIMM, and both can appear in the same token. Kit notation states the total first. “LOT” without a count does not mean quantity greater than one. Part numbers are more authoritative than the title text around them.

Rather than encoding all that in regex, every title goes through DeepSeek (deepseek-v4-flash, their cheap model) with a system prompt full of those domain rules, returning structured JSON validated by a pydantic schema:

class RamSpec(BaseModel):
    is_ram: bool          # False for trays, heat spreaders, "for parts" boards
    qty: Optional[int]    # lot/kit aware stick count
    per_stick_gb: Optional[int]
    total_gb: Optional[int]
    ddr_gen: Optional[int]        # 3, 4, 5
    module_type: Optional[str]    # RDIMM | LRDIMM | UDIMM | SODIMM
    speed_mts: Optional[int]      # PC4-21300 -> 2666
    # ... rank, voltage, ECC, part number

Titles are batched 25 per API call with an index round-trip check so a misaligned response fails loudly instead of assigning specs to the wrong listings. Against a hand-labeled fixture set it scored 97.4% field accuracy on the first eval run, and the misses were fields that only existed encoded inside part numbers (a future deterministic PN-decode layer will catch those).

The economics are the part that still makes me smile. At roughly $0.09 per 1,000 titles, the total LLM bill for parsing every listing DIMMsum has ever seen is about two dollars. This pipeline was not possible on a hobby budget three years ago; now it is basically free.

The plumbing

Everything lands in Postgres on my Proxmox cluster (one VM for the scraper + web app, one for the database). A systemd timer scrapes every 6 hours, and each run records a price snapshot per listing, which means DIMMsum builds its own price history for every item it tracks. The web side is FastAPI plus one vanilla JavaScript file. No framework. The whole site is a scatter chart, a table, and some server-rendered spec pages.

Current state of the database after a few days of running:

MetricCount
RAM listings tracked10,697
Price snapshots104,475
Search queries per run51
Scrape frequencyevery 6 hours
LLM parse cost, lifetime~$2

Claude (Fable 5, via Claude Code) wrote most of this code with me over a few evenings. The architecture arguments were real arguments and it lost some of them, but I will happily credit it with the claim-column work queue pattern that lets me run parallel parse workers against Postgres without them stepping on each other.
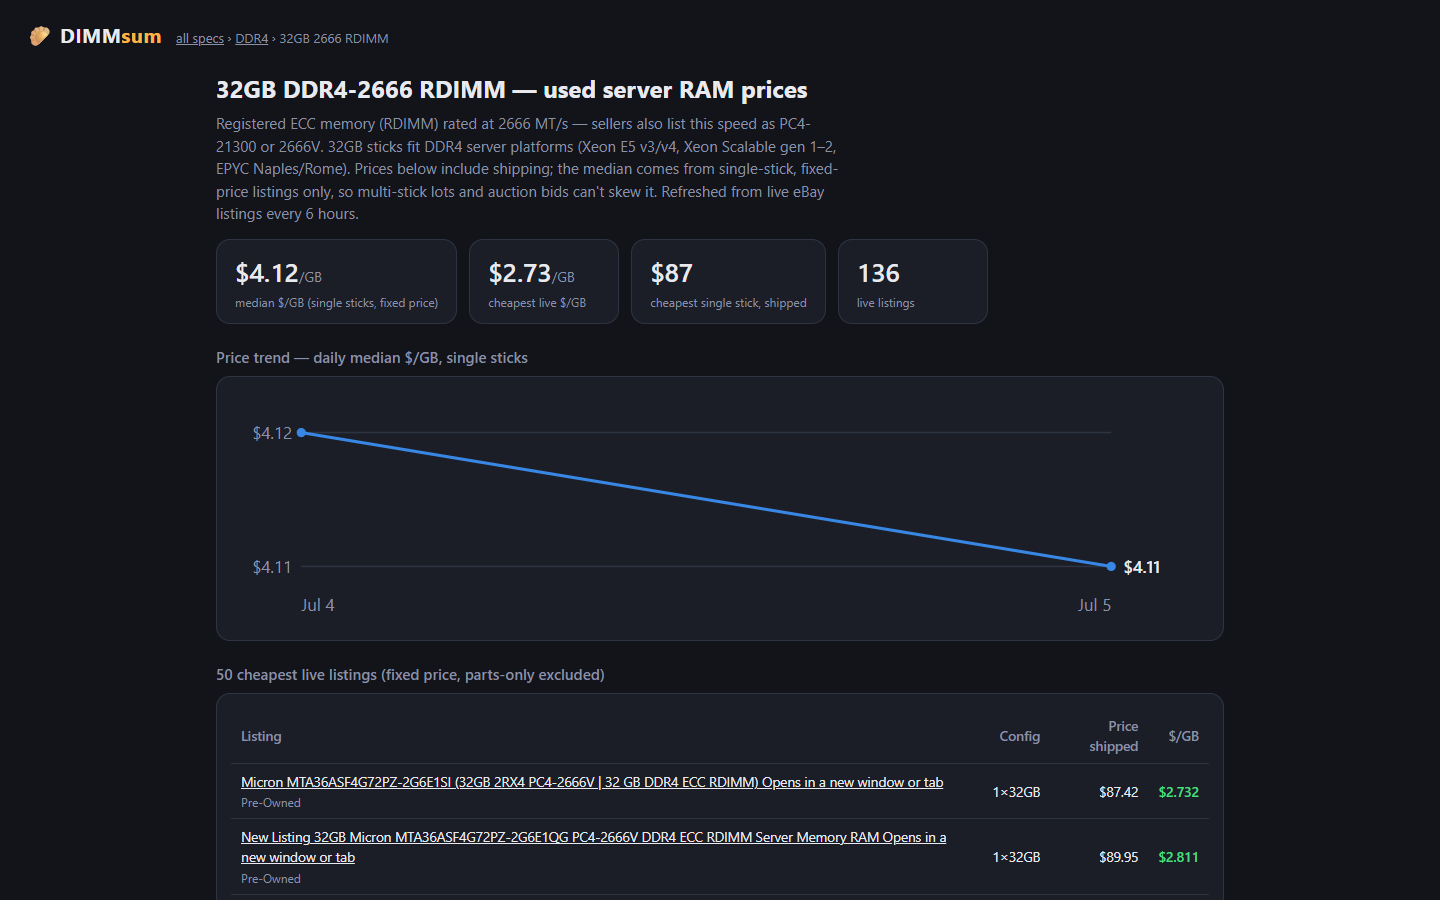
The spec page for 32GB DDR4-2666 RDIMM: median and cheapest stat tiles, daily price trend, and the 50 cheapest live listings

Sold prices (the part I am most excited about)

Active listing prices tell you what sellers are asking. Sold prices tell you what buyers actually paid, and those are very different numbers on eBay.

I assumed for months that scraping sold/completed listings was off the table and never actually tested it. Turns out the same polite-human browsing approach handles the sold/completed view just fine, and eBay hands you sold prices with dates, 240 per page. I was wrong for months for no reason. Test your assumptions, folks.

So as of this week DIMMsum also harvests sold listings weekly into their own table. The first sweep pulled in over 8,000 real sales, and the sold history goes back further than the ~90 days I expected (most of the usable volume reaches back to late 2025). That data is going to power a monthly “state of the used RAM market” report: median $/GB by SKU, month over month, from real transactions. The June data already shows 8GB DDR4-2133 RDIMMs sliding from $3.50/GB in April to $3.12 in June, and that is exactly the kind of thing I want a monthly email about.

There is a signup box at the bottom of dimmsum.com for exactly that report. One email a month, actual data, no other nonsense.

Disclosure and what’s next

The site is monetized with eBay Partner Network affiliate links: if you click through and buy, eBay pays a commission. That is the entire business model. Free site, no ads, no accounts, and the full disclosure lives in the footer.

Next up: the monthly sold-price report, a storage version (same idea, $/TB for used enterprise SSDs and HDDs, already in progress as a separate project), and a part-number decode table to squeeze out the last few percent of parse accuracy.

Go find some cheap RDIMMs at dimmsum.com. My benchmark SKU (32GB DDR4-2666 RDIMM singles) has a median around $132 a stick right now with the floor meaningfully below that, and now I get to watch the market instead of refreshing eBay searches like an animal.
Categories
Chrony DIY homelab Linux NTP PTP Raspberry Pi

From Milliseconds to 26 Nanoseconds: How a $20 eBay SFP Module Beat My Entire NTP Setup

Welcome to Austin’s Nerdy Things, where we spend years chasing nanoseconds that nobody asked us to chase.

Five years ago, I started this blog by building a microsecond-accurate NTP server with a Raspberry Pi and PPS GPS. Then I went simpler – a $12 USB GPS for millisecond-accurate NTP because ease of use matters too. Then I spent months doing thermal management on the CPU to squeeze out another 81% improvement. My beloved Raspberry Pi 3B has been sitting at around +/- 200 nanoseconds for over a year now, and I figured that was about as good as it gets for consumer hardware.

A $20 eBay purchase from two years ago just demolished all of that.

The Hardware: Telecom Surplus for Pocket Change

The key piece is an Oscilloquartz OSA-5401 – a GPS-disciplined PTP grandmaster clock in an SFP form factor. These things were designed to plug into telecom switches and provide IEEE 1588 Precision Time Protocol timing for cellular networks. They have a built-in GPS receiver, an OCXO (oven-controlled crystal oscillator), and an FPGA that handles hardware PTP timestamping. New, they cost thousands of dollars. On eBay, a handful of decommissioned units went for $20. Now they’re unavailable. If they do appear (rarely), they’re $300-500.

I first spotted these on a ServeTheHome forum thread back in 2024. Someone found a batch on eBay for $20 each and I jumped on one. The firmware doesn’t include the NTP server feature from the spec sheet (that requires a license), but it spews PTP multicast frames on power-up – and that turns out to be all you need. I posted the first working PTP+chrony config in that thread, which others used as a starting point.

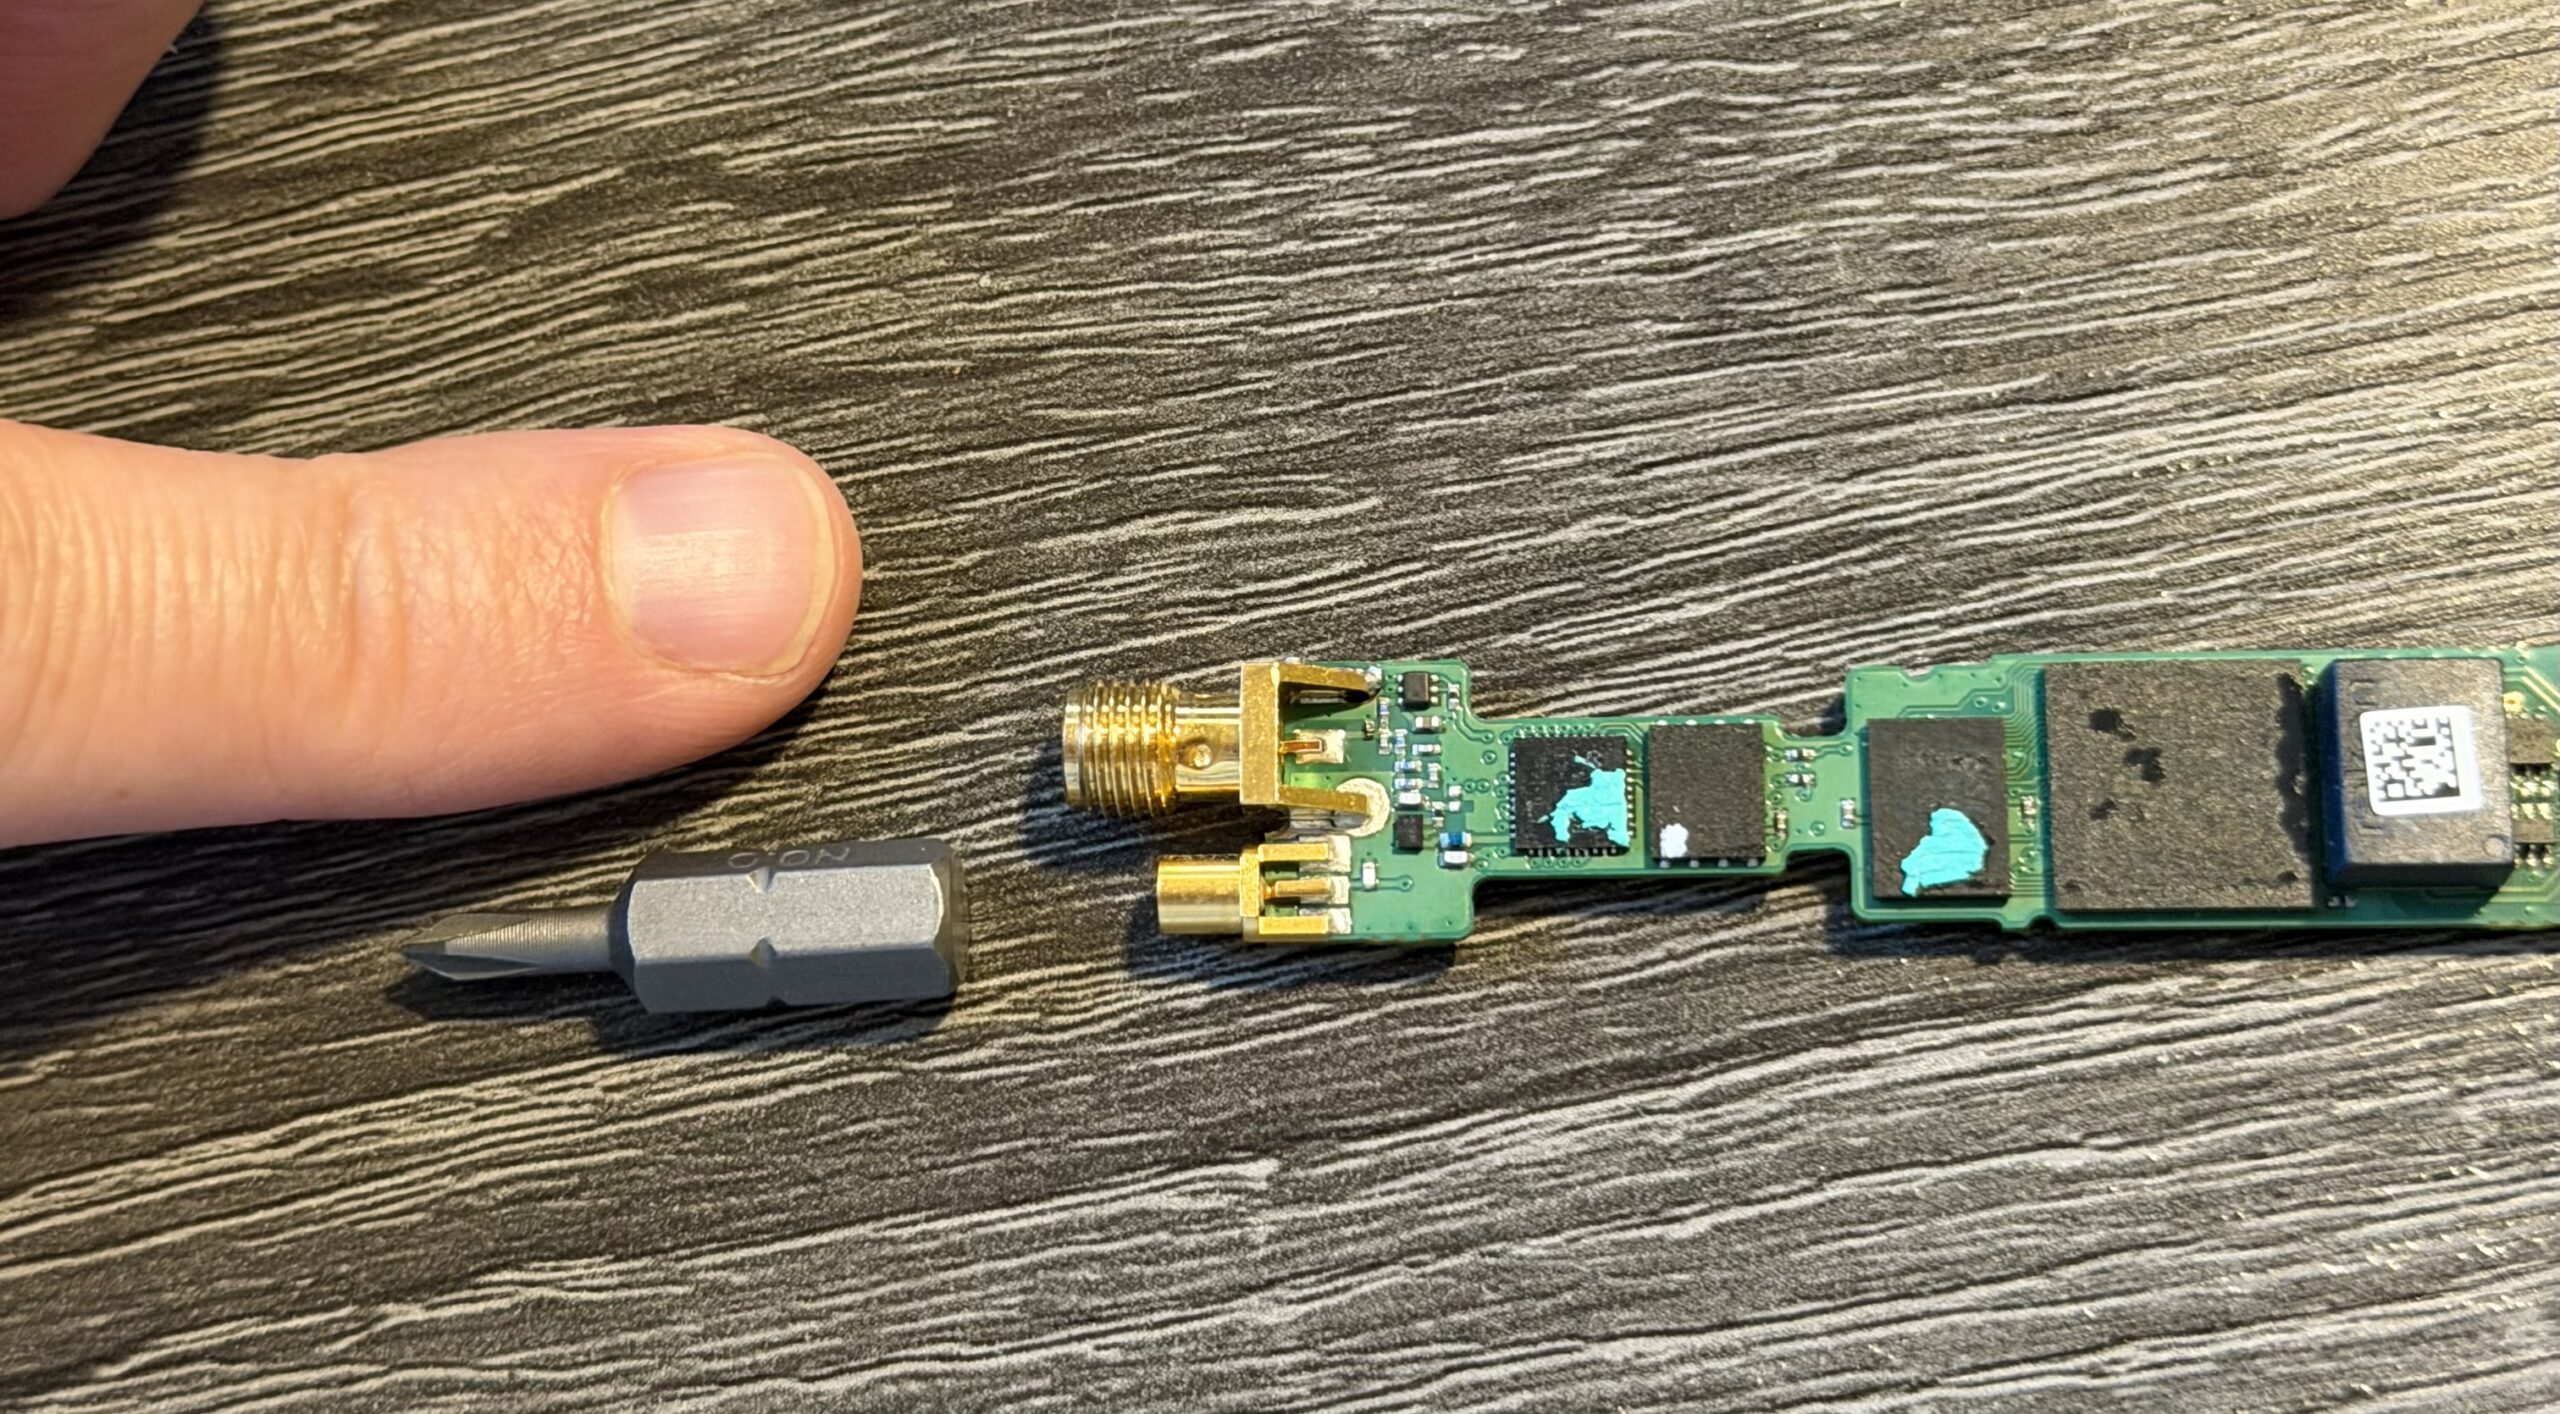
Mine was flaky from the start – the antenna would intermittently disconnect. I reported in the thread that “wiggling the module helped,” which in retrospect should have been a bigger clue. When I finally pulled the board out of the SFP housing, I found the GNSS SMA connector had broken loose from the PCB – probably cracked during decommissioning. A few minutes with a soldering iron fixed that, and it’s been rock solid since. Here’s the board with the resoldered connector, screwdriver bit for scale:

OSA-5401 PCB with resoldered GNSS SMA connector, screwdriver bit for scale

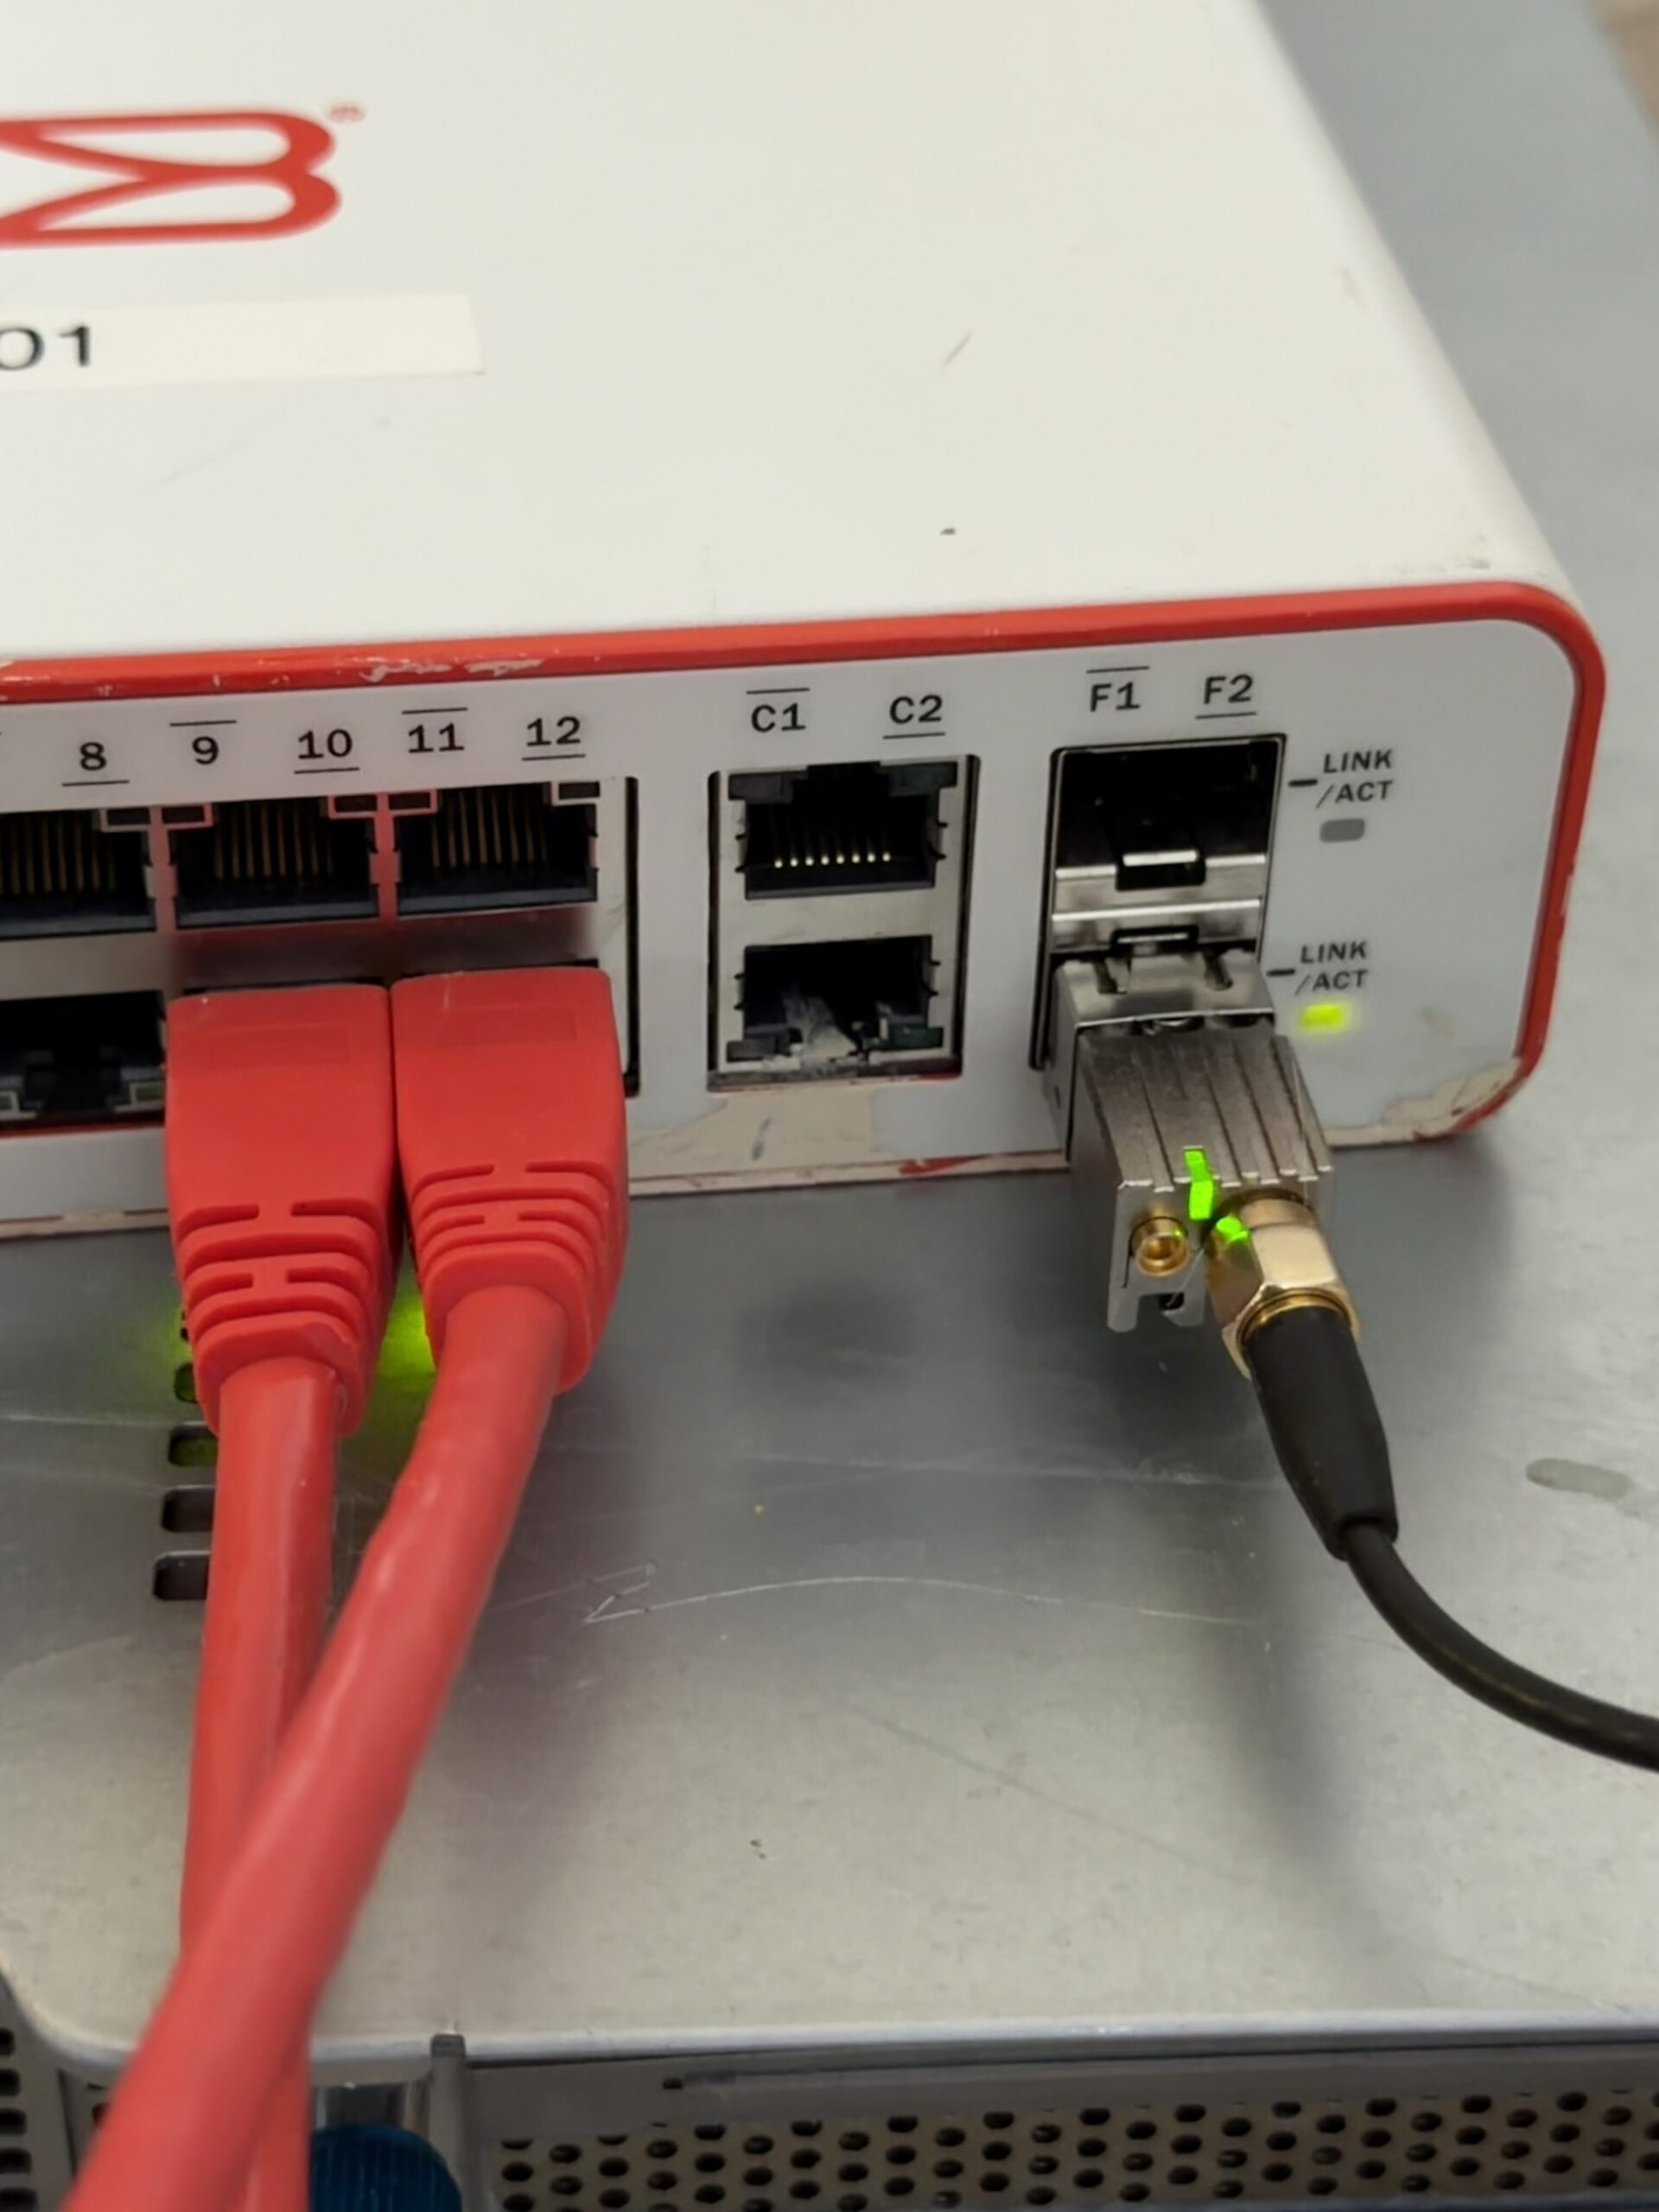
And installed in port F2 of a Brocade ICX6430-C12 switch, GPS antenna connected:

OSA-5401 installed in a Brocade ICX6430-C12 SFP port with GPS antenna

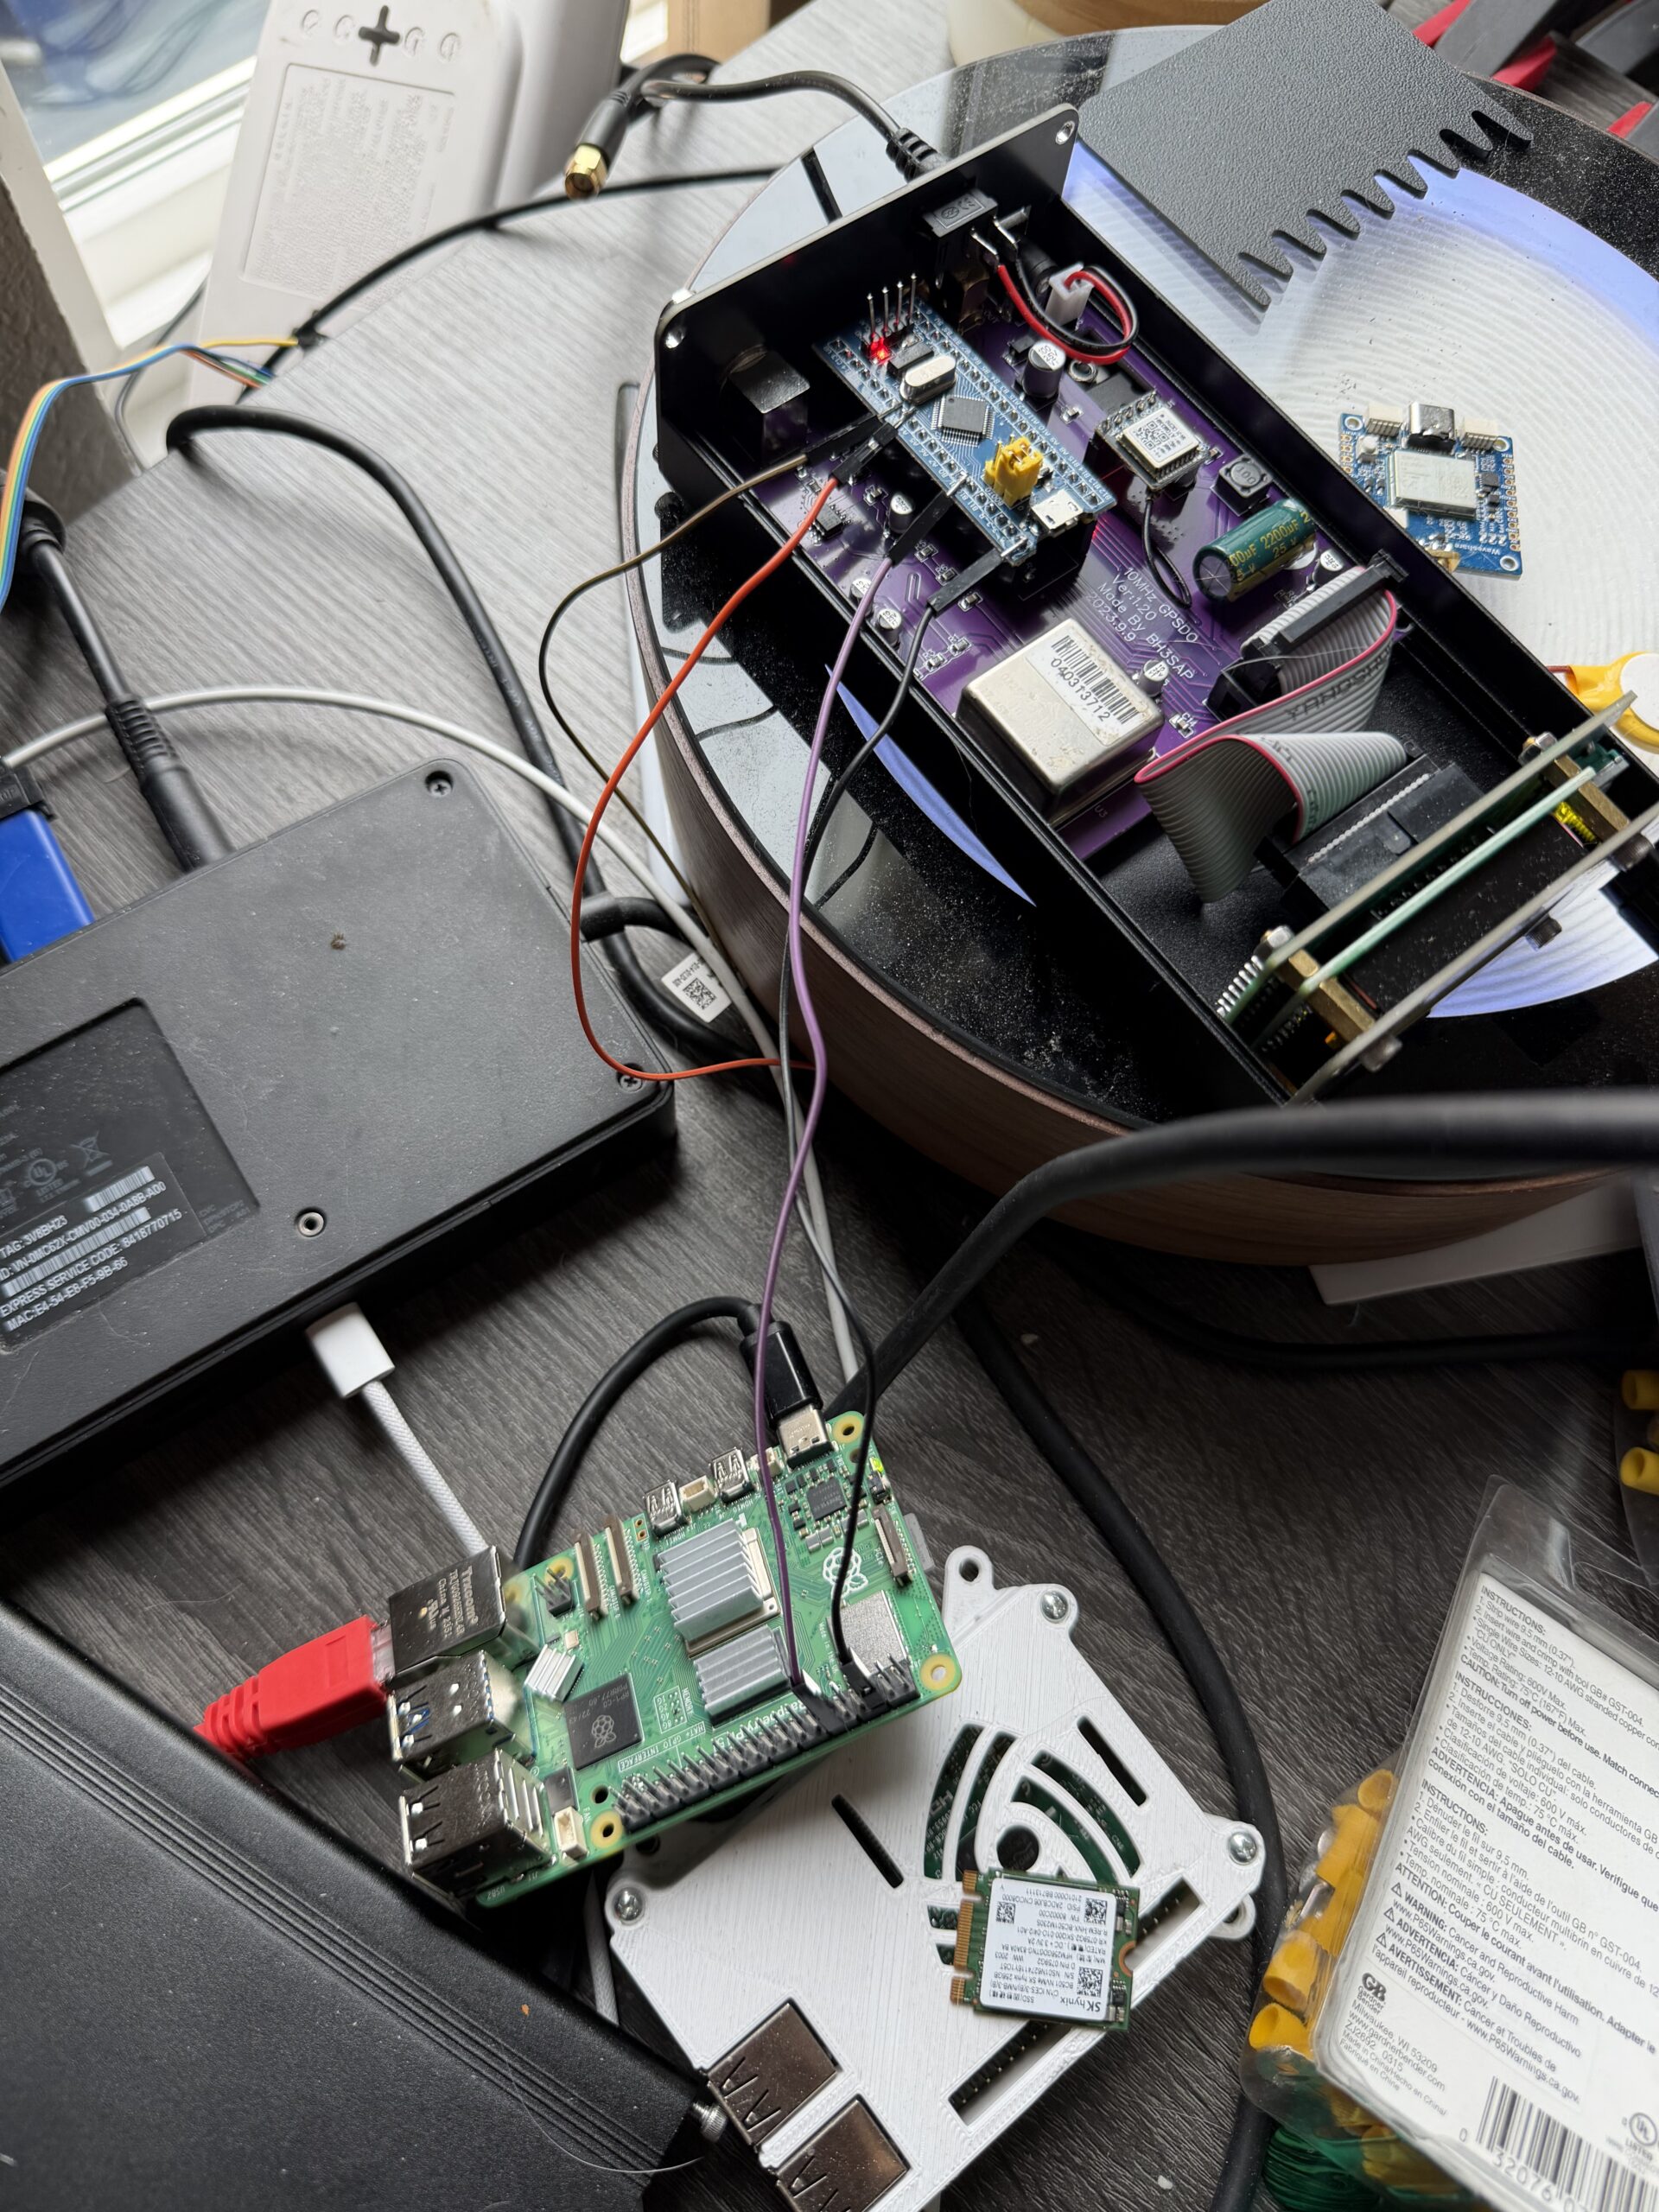
I also have a BH3SAP GPSDO that I picked up for about $70 on eBay – one of those Chinese units with an OX256B OCXO and an STM32 Blue Pill microcontroller. There’s a great thread on EEVBlog about these. I soldered some jumper wires to the MCU PPS output and connected it to GPIO 18 on my Raspberry Pi 5. I’ve been running custom firmware on it (based on fredzo’s gpsdo-fw) with some modifications for telemetry and flywheel display.

The whole mess wired together – GPSDO PPS jumper wires running to the Pi 5’s GPIO header:

GPSDO connected to Raspberry Pi 5 via PPS jumper wires

The Raspberry Pi 5 has hardware timestamping on its Ethernet NIC, which gives it a /dev/ptp0 PTP hardware clock (PHC). This is critical – without hardware timestamping, PTP is no better than NTP. The Pi 5’s Ethernet controller supports it natively.

Here’s the setup:

  • OSA-5401 ($29) – GPS-disciplined PTP grandmaster, plugged into an SFP port on my network switch
  • BH3SAP GPSDO (~$70) – GPS-disciplined OCXO, PPS output wired to Pi 5 GPIO
  • Raspberry Pi 5 – running ptp4l (for PTP) and chronyd (for everything else)
  • Total cost of timing hardware: ~$100

The Software Stack

The timing chain has two hops:

  1. ptp4l receives PTP sync messages from the OSA-5401 over Ethernet and disciplines the Pi’s PTP hardware clock (/dev/ptp0)
  2. chrony reads the hardware clock as a refclock and disciplines the system clock

ptp4l configuration (/etc/linuxptp/ptp4l-osa.conf):

[global]
slaveOnly		1
domainNumber		24
network_transport	L2
time_stamping		hardware
delay_mechanism		E2E
clock_servo		pi
logging_level		6
summary_interval	0

twoStepFlag		1
first_step_threshold	0.00002
step_threshold		0.0
max_frequency		900000000
sanity_freq_limit	200000000

ptp_dst_mac		01:1B:19:00:00:00
p2p_dst_mac		01:80:C2:00:00:0E

[eth0]

The chrony refclock configuration for PTP (/etc/chrony/conf.d/ptp-osa.conf):

# OSA-5401 via ptp4l -> PHC0
# ptp4l disciplines /dev/ptp0 to PTP timescale (TAI)
# tai lets chrony apply the current TAI-UTC offset from its leap second table
refclock PHC /dev/ptp0 refid PTP dpoll -4 poll 0 filter 5 precision 1e-9 tai

A few things worth noting:

  • tai tells chrony the PHC is on TAI timescale and to automatically apply the current TAI-UTC offset (currently 37 seconds). This is better than hardcoding offset -37 because it auto-updates if a leap second is ever announced again.
  • dpoll -4 means chrony reads the PHC 16 times per second. I initially had this at dpoll 0 (once per second), but a tcpdump revealed the OSA-5401 is actually sending PTP sync messages at 16 Hz, not 1 Hz. So there’s fresh data to read.
  • filter 5 takes the median of 5 consecutive reads, rejecting outliers.
  • precision 1e-9 tells chrony the refclock is accurate to 1 nanosecond, which tightens the error bounds that chrony uses in source selection.

The Bug: Why Chrony Refused to Use the Better Source

When I first got this all running, I had both PPS (from the GPSDO) and PTP (from the OSA-5401) configured as refclocks. The GPSDO had lost GPS lock overnight and had been flywheeling for about 12 hours. PTP was clearly the better source – lower jitter, independent GPS reference. But chrony stubbornly stayed on PPS.

Here’s what chronyc sources showed:

MS Name/IP address         Stratum Poll Reach LastRx Last sample
===============================================================================
#* PPS                           0   2   377     5   -114ns[ -132ns] +/-  101ns
#x PTP                           0   2   377     3    -59us[  -59us] +/-  101ns

PPS was selected (*) and PTP was marked x – “may be in error.” But PTP wasn’t in error. The GPSDO had drifted 59 microseconds during 12 hours of flywheel, and chrony was faithfully following it off a cliff.

The culprit was in the PPS refclock config:

refclock PPS /dev/pps0 refid PPS dpoll 0 poll 2 filter 3 precision 1e-7 prefer trust

That trust flag is nuclear. It tells chrony: “this source is always correct – never classify it as a falseticker.” Combined with prefer, chrony would choose PPS no matter how much every other source disagreed with it. Three sources (PTP, pi-ntp, pfsense) all agreed the system clock was off by ~59 μs, but chrony trusted PPS absolutely and marked PTP as suspicious instead.

The fix was simple: remove trust. And after some more testing, remove prefer too. Let chrony’s selection algorithm do its job. As soon as I did that:

MS Name/IP address         Stratum Poll Reach LastRx Last sample
===============================================================================
#- PPS                           0   2    17     1    +59us[  +59us] +/-  101ns
#* PTP                           0   2    37     2    +22ns[  -83ns] +/-   18ns

PTP immediately took over. PPS correctly demoted to - (valid but not selected), showing +59 μs offset – the accumulated GPSDO flywheel drift.

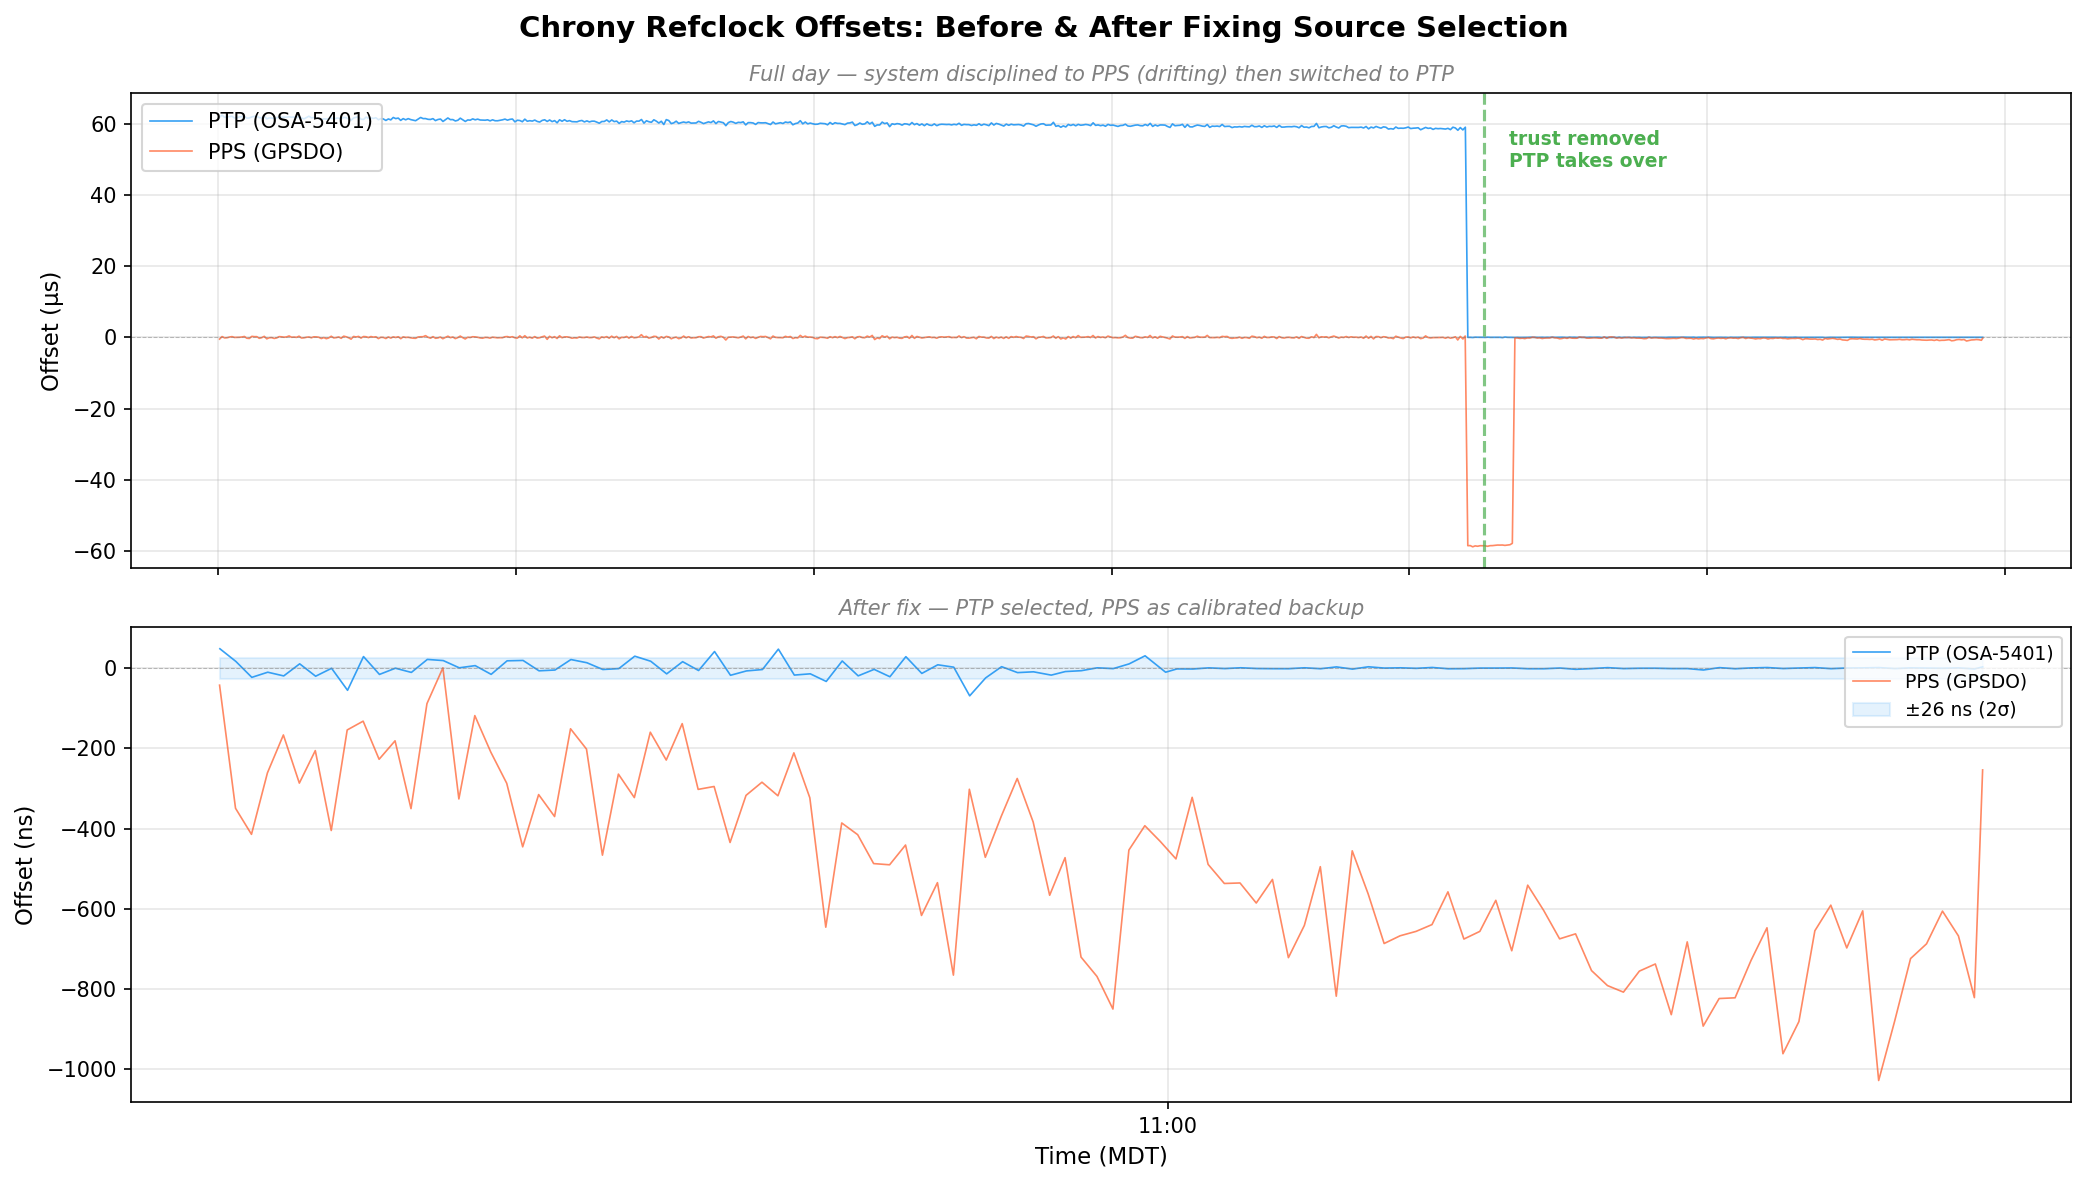
Here’s the full day of refclock data. The top panel is in microseconds – you can see PTP sitting at +60 μs the whole morning because the system clock was following the drifting GPSDO. Then the fix lands around 08:30 MDT and everything snaps into place. The bottom panel zooms into the post-fix period in nanoseconds:

Chrony refclock offsets before and after fixing source selection - PTP drops from 60μs to near-zero
Chrony refclock offsets before and after fixing source selection – PTP drops from 60μs to near-zero

Discovering the 58.3 Microsecond MCU Bias

Once the GPSDO regained GPS lock, I expected PPS to converge back toward PTP. It didn’t. It settled at a rock-solid +58 μs offset with 474 ns standard deviation. Locked, stable, just… late.

The BH3SAP GPSDO doesn’t pass the GPS module’s PPS signal directly to the output. It goes through the STM32 microcontroller – GPIO interrupt, some processing, then the MCU asserts the output pin. And traverses a jumper wire with questionable soldering. That path adds latency (and a not very clean edge). With PTP as ground truth, I could now measure exactly how much.

I pulled 500 samples from chrony’s refclock log and crunched the numbers:

StatValue
Mean-58.319 μs
Median-58.372 μs
Std Dev787 ns
P5–P95-59.2 to -57.4 μs
Range9.8 μs peak-to-peak

A consistent 58.3 microsecond delay. Sub-microsecond jitter – the MCU interrupt path is deterministic, just slow. The fix is a static offset in the chrony config:

refclock PPS /dev/pps0 refid PPS dpoll 0 poll 2 filter 3 precision 1e-7 offset 0.0000583

After applying the offset and restarting chrony:

MS Name/IP address         Stratum Poll Reach LastRx Last sample
===============================================================================
#- PPS                           0   2    37     4   +425ns[ +423ns] +/-  101ns
#* PTP                           0   2    77     4    -24ns[  -26ns] +/-   18ns

PPS went from +58 μs to +425 ns. The two sources now agree to within a microsecond, and PPS is a legitimate backup if PTP ever drops.

The Results: ±26 Nanoseconds

After tuning the PTP refclock parameters (dpoll -4, poll 0, filter 5), here are the final numbers:

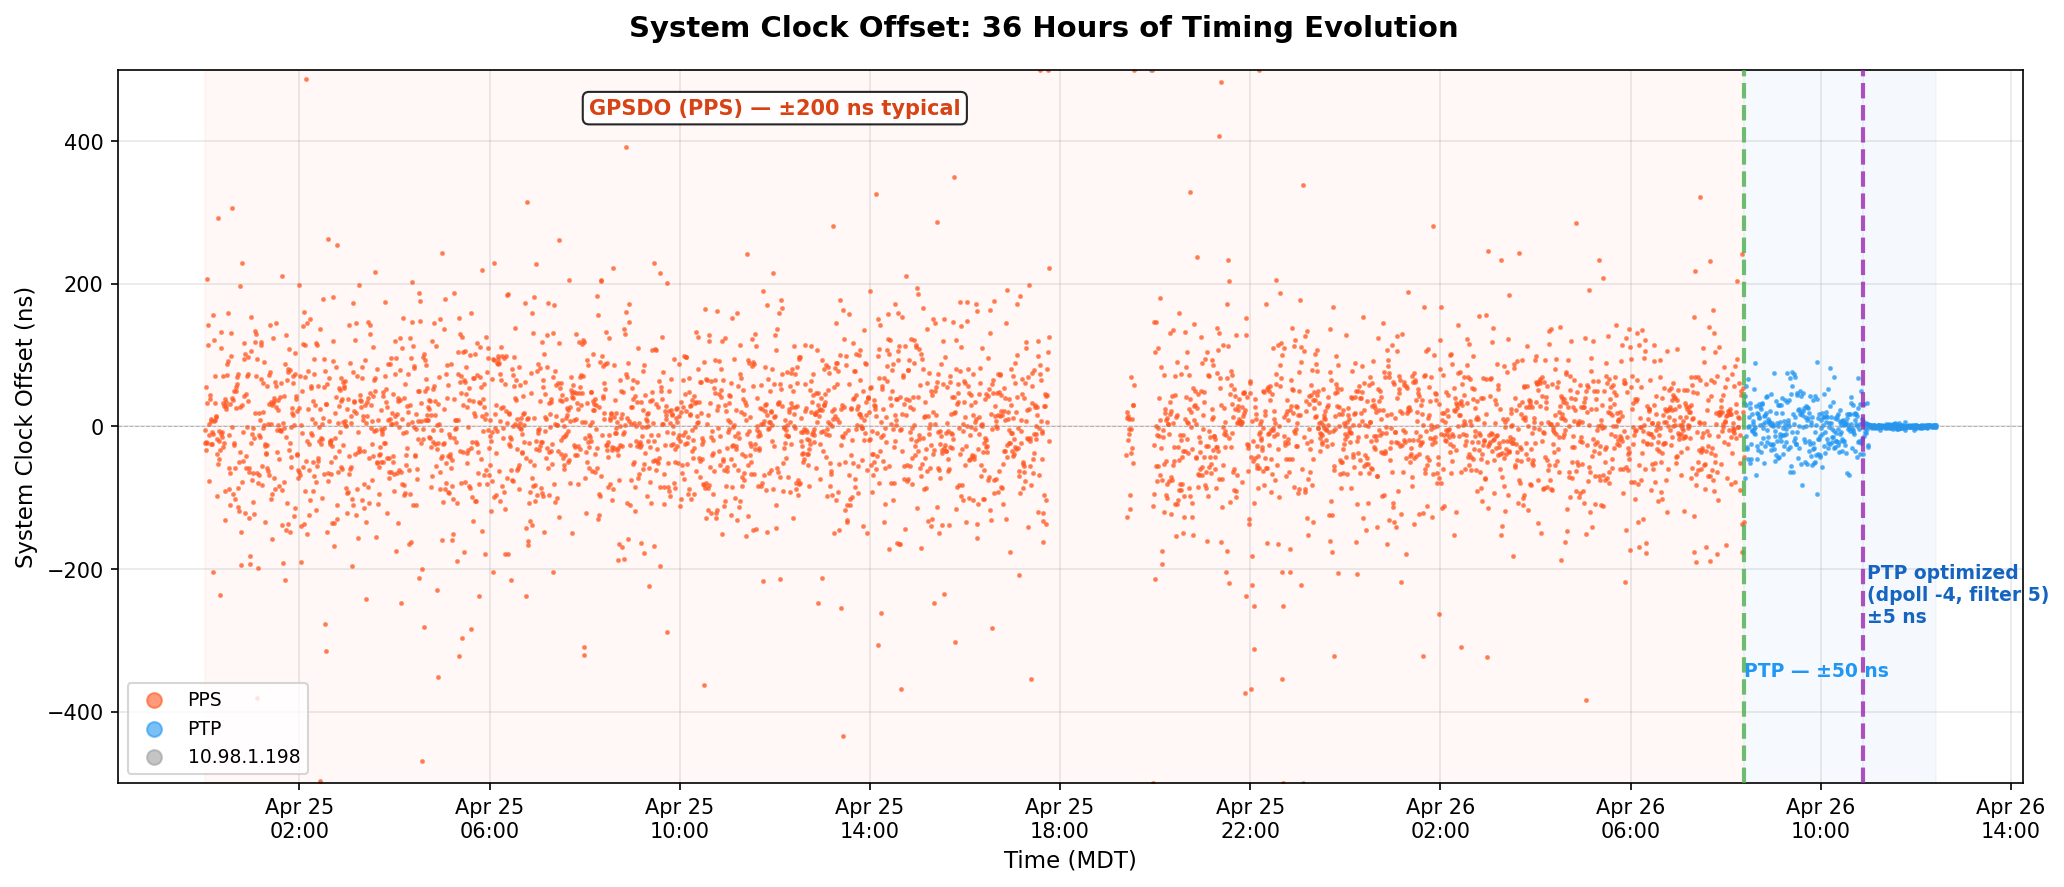
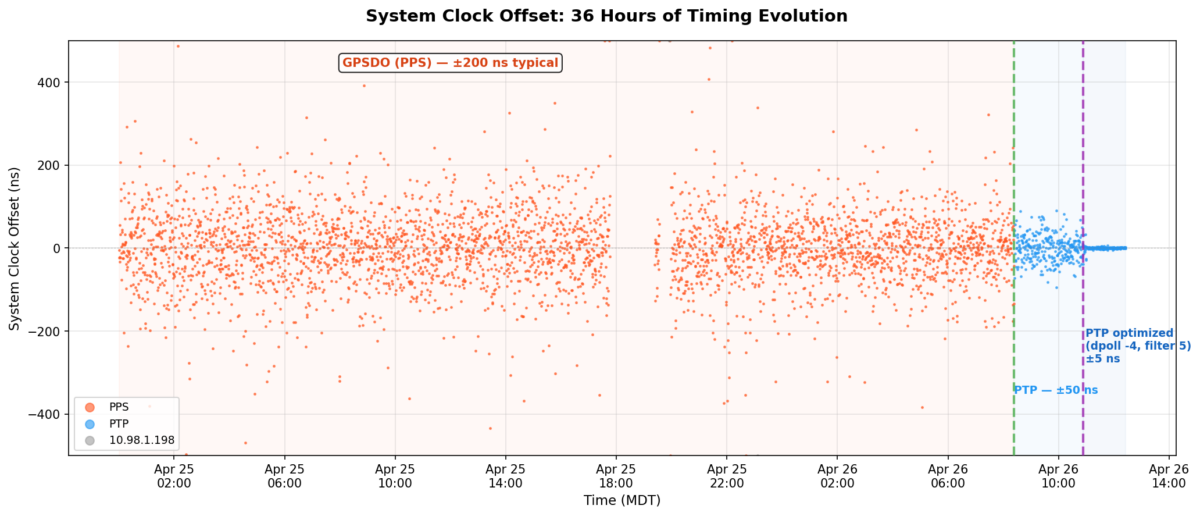
But first, here’s the big picture. This is 36 hours of chrony’s tracking offset – the actual error between the system clock and whatever reference chrony was using at the time:

System clock offset over 36 hours - PPS scattered at ±200 ns, then PTP collapses it to a thin line
System clock offset over 36 hours – PPS scattered at ±200 ns, then PTP collapses it to a thin line

The orange scatter is the GPSDO’s PPS running chrony for a day and a half – ±200 ns on a good minute, ±400 ns on a bad one. The green dashed line is the moment I removed trust and PTP took over. The purple line is when I cranked the polling rate to 16 Hz. After that, the data is a flat line at zero on this scale.

ptp4l (OSA-5401 → Pi hardware clock):

MetricValue
RMS offset11.8 ns
Max offset17 ns
Path delay3,160 ns

chrony (Pi hardware clock → system clock):

MetricValue
Std Dev5 ns
RMS offset4 ns
Frequency skew0.002 ppm

Combined error budget (root sum of squares):

LayerError
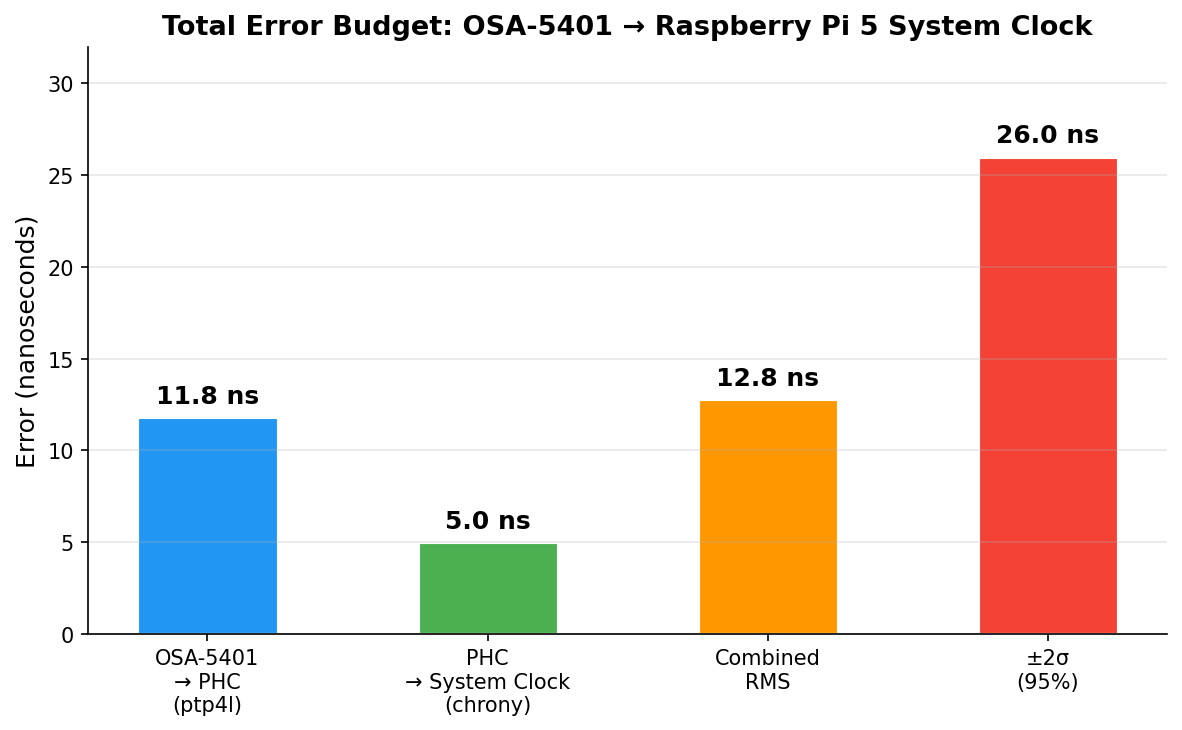
OSA-5401 → PHC (ptp4l)11.8 ns
PHC → system clock (chrony)5.0 ns
Combined RMS12.8 ns
±2σ (95% confidence)±26 ns

For comparison, my Pi 3B NTP server that’s been running for years:

MetricPi 3B (GPS PPS + NTP)Pi 5 (PTP + OSA-5401)
RMS offset182 ns4 ns
Std Dev312 ns5 ns
2σ bound~±600 ns±26 ns
Improvementbaseline~45x better
Error budget breakdown - ptp4l dominates at 11.8 ns, chrony adds 5 ns, combined 12.8 ns RMS
Error budget breakdown – ptp4l dominates at 11.8 ns, chrony adds 5 ns, combined 12.8 ns RMS

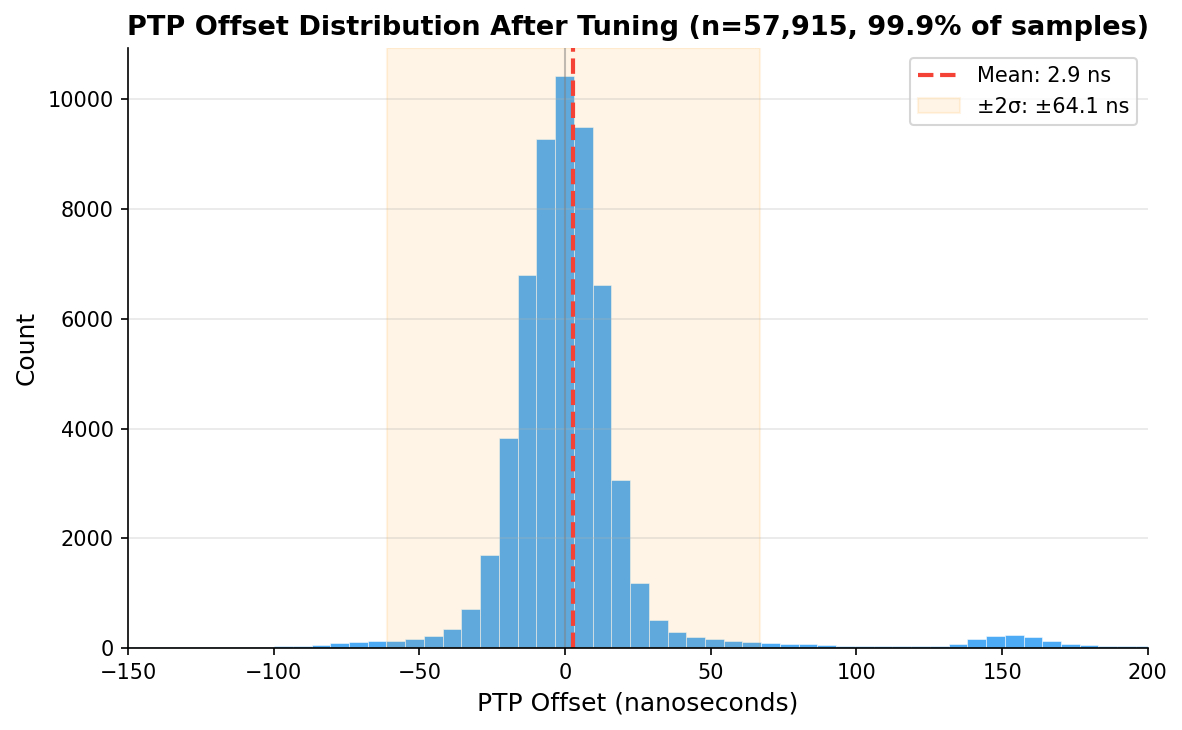
And here’s the distribution of 57,915 PTP offset samples after tuning. Mean of 2.9 ns, tight Gaussian centered right on zero:

PTP offset histogram after tuning - 57,915 samples, mean 2.9 ns
PTP offset histogram after tuning – 57,915 samples, mean 2.9 ns

Checking Our Work: What Does the Raw Data Actually Say?

Those numbers above come from what the servos report. ptp4l prints a 1 Hz RMS summary. chrony’s sourcestats shows the standard deviation of its filtered, averaged output. Both are honest numbers, but they’re the numbers after each servo has done its best to smooth things out. What does the raw measurement data look like?

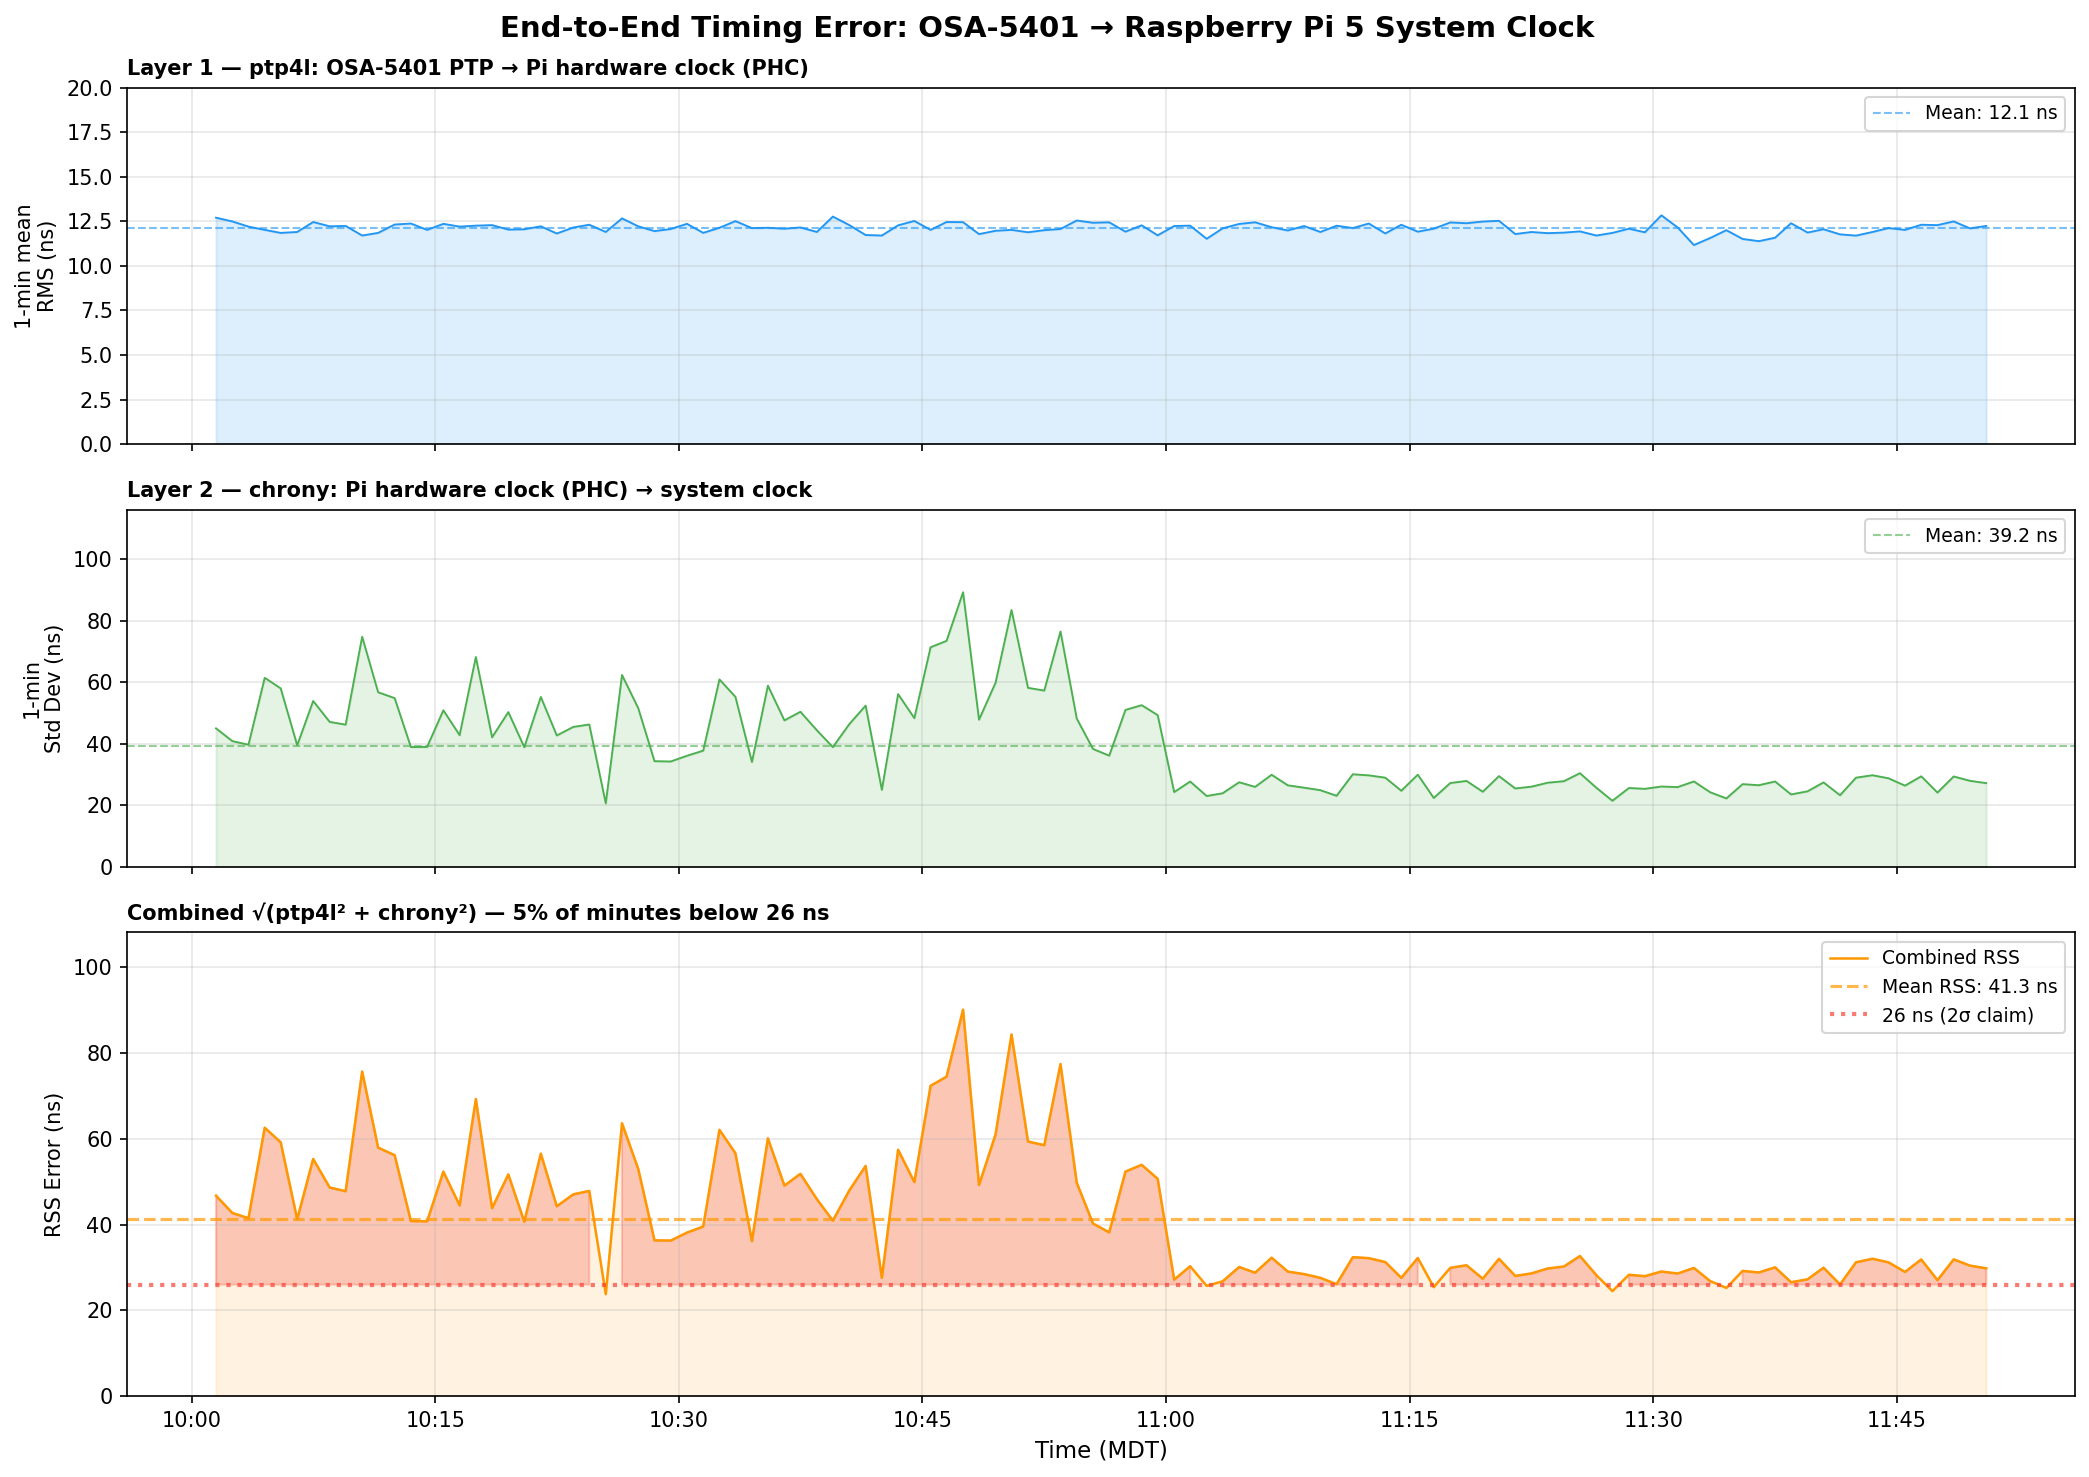
I pulled 110 minutes of overlapping data – ptp4l’s 1 Hz journal summaries and chrony’s 16 Hz raw refclock offset log – and computed 1-minute rolling statistics for each layer, then combined them as root sum of squares:

End-to-end timing error analysis - ptp4l at 12 ns, chrony raw jitter at 39 ns, combined RSS at 41 ns
End-to-end timing error analysis – ptp4l at 12 ns, chrony raw jitter at 39 ns, combined RSS at 41 ns

Three things jump out:

ptp4l is the stable one. Layer 1 (OSA-5401 → PHC) sits at 12.1 ns mean RMS and barely moves. The FPGA doing the hardware timestamping in the OSA-5401 earns its keep here – there’s just not much noise to begin with.

chrony’s raw readings are noisier than its filtered output suggests. The 16 Hz PHC reads have a 39 ns mean standard deviation per minute, with spikes up to 90 ns. But chrony’s sourcestats reports 5 ns – because the median-of-5 filter and the PI servo smooth that out before it touches the system clock. Both numbers are real; they measure different things.

The honest combined number is ±40–50 ns typical, not ±26 ns. The ±26 ns figure from chrony’s tracking output reflects the post-filter error – what the system clock actually experiences after chrony has done its smoothing. The raw measurement chain has more jitter than that. You can see the combined RSS settling toward 27–30 ns in the last hour as the servo tightened, but 40 ns is a fairer typical value.

Even at ±50 ns, that’s still 4× better than the Pi 3B’s ±200 ns. And the trend in the last hour suggests it keeps improving as chrony accumulates more data and tightens its frequency estimate.

GPSDO Flywheel Testing

With the PTP source providing a known-good reference, I can now characterize the GPSDO’s holdover performance. I unplugged the GPSDO’s GPS antenna and let it flywheel on its OCXO. Early results after the first hour showed drift still buried in the noise floor – under 100 ns/hr. The OX256B OCXO in this $70 unit might actually be decent. I’m collecting data for a longer run and will update this post (or write a follow-up) with the full holdover curve.

The dream setup is adding a DS18B20 temperature sensor directly to the OCXO case so I can correlate thermal drift with the oscillator’s frequency offset. That would let me separate temperature-driven drift from aging – but that’s a project for another weekend.

The Journey: Five Years, Six Orders of Magnitude

YearPostMethodAccuracy
2021USB GPS NTPNTP over USB serial~1 ms
2021GPS PPS NTPGPIO PPS + chrony~1 μs
2025Revisiting in 2025Tuned chrony + Pi 3B~200 ns
2025Thermal managementCPU temp stabilization~86→16 ns RMS
2026This postPTP + OSA-5401±26 ns

From a $12 USB GPS dongle to a $29 telecom SFP module. From milliseconds to nanoseconds. The total cost of the timing hardware in my current setup is about $100, and it’s achieving accuracy that used to require five-figure test equipment.

The next step down would be sub-nanosecond, and that requires White Rabbit – dedicated hardware, specialized SFP transceivers, and budgets measured in tens of thousands. For commodity Ethernet and general-purpose Linux, ±26 nanoseconds is pretty much the floor.

I think I’m done. (For now.) At least, that’s what I told my wife.

Configs for Reference

PTP refclock (/etc/chrony/conf.d/ptp-osa.conf)

# OSA-5401 via ptp4l -> PHC0
# ptp4l disciplines /dev/ptp0 to PTP timescale (TAI)
# tai lets chrony apply the current TAI-UTC offset from its leap second table
refclock PHC /dev/ptp0 refid PTP dpoll -4 poll 0 filter 5 precision 1e-9 tai

PPS refclock (/etc/chrony/conf.d/pps-gpsdo.conf)

# GPSDO 1 Hz PPS on GPIO 18
# dpoll 0 = read every pulse (1 Hz)
# filter 3 = median of 3 samples (odd count for true median)
# poll 2 = 4s loop update (2^2=4 >= filter 3)
# offset = MCU PPS delay compensation (58.3us measured against PTP)
refclock PPS /dev/pps0 refid PPS dpoll 0 poll 2 filter 3 precision 1e-7 offset 0.0000583

# Accurate LAN NTP server - coarse time for PPS second identification
server 10.98.1.198 iburst minpoll 4 maxpoll 6

ptp4l service

/usr/sbin/ptp4l -f /etc/linuxptp/ptp4l-osa.conf -i eth0

chrony main config highlights

log tracking measurements statistics refclocks
maxupdateskew 0.1
rtcsync
makestep 1 -1
leapsectz right/UTC
hwtimestamp *

The hwtimestamp * line enables hardware timestamping on all interfaces, and leapsectz right/UTC is required for the tai refclock option to work correctly.


Disclosure: When you click on links to various merchants in this post and make a purchase, this can result in this site earning a commission. Affiliate programs and affiliations include, but are not limited to, the eBay Partner Network.

Categories
homelab Linux proxmox

Proxmox Cluster manual update

Recently ran into an issue where I added a node to my Proxmox cluster while a node was disconnected & off. That node (prox) caused the others to become unresponsive for a number of Proxmox things (it was missing from the cluster) upon boot.

Set node to local mode

The solution was to put the node that had been offline (called prox) into “local” mode. Thanks to Nicholas of Technicus / techblog.jeppson.org for the commands to do so:

sudo systemctl stop pve-cluster
sudo /usr/bin/pmxcfs -l

This allows editing of the all-important /etc/pve/corosync.conf file.

Manually update corosync.conf

I basically just had to copy over the config present on the two synchronized nodes to node prox, then reboot. This allowed node prox to join the cluster again and things started working fine.

Problem corosync.conf on node prox:

logging {
  debug: off
  to_syslog: yes
}

nodelist {
  node {
    name: prox
    nodeid: 1
    quorum_votes: 1
    ring0_addr: 10.98.1.14
  }
  node {
    name: prox-1u
    nodeid: 2
    quorum_votes: 3
    ring0_addr: 10.98.1.15
  }
}

quorum {
  provider: corosync_votequorum
}

totem {
  cluster_name: prox-cluster
  config_version: 4
  interface {
    linknumber: 0
  }
  ip_version: ipv4-6
  secauth: on
  version: 2
}

Fancy new corosync.conf on nodes prox-1u and prox-m92p:

logging {
  debug: off
  to_syslog: yes
}

nodelist {
  node {
    name: prox
    nodeid: 1
    quorum_votes: 1
    ring0_addr: 10.98.1.14
  }
  node {
    name: prox-1u
    nodeid: 2
    quorum_votes: 3
    ring0_addr: 10.98.1.15
  }
  node {
    name: prox-m92p
    nodeid: 3
    quorum_votes: 1
    ring0_addr: 10.98.1.92
  }
}

quorum {
  provider: corosync_votequorum
}

totem {
  cluster_name: prox-cluster
  config_version: 5
  interface {
    linknumber: 0
  }
  ip_version: ipv4-6
  secauth: on
  version: 2
}

The difference is that third node item as well as incrementing the config_version from 4 to 5. After I made those changes on node prox and rebooted, things worked fine.