A one-sentence summary is as follows: ZFS is a highly advanced & adaptable file system with multiple features to enhance performance, including the SLOG/ZIL (Separate Log Device/ZFS Intent Log), which essentially functions as a write cache for synchronous writes. For a more detailed write-up, see Jim Salter’s ZFS sync/async ZIL/SLOG guide.
Now to jump right into the performance.
A different (faster) test machine
I popped the P1600X into an M.2 slot of a different machine I have here at home and was very surprised at how much faster it was than in the previous test box. I know the Xeon D series isn’t exactly known for speed but people always say speed doesn’t really matter for storage. I guess being in the Major Leagues with these Optane devices means that processor speed does in fact matter. The single-thread speed of the 2678v3 isn’t a lot higher than the D-1541 (same generation Xeon) but the multi-thread is ~40% faster.
Intel did provide the Optane devices but did not make any demands on what to write about or how to write it, nor did they review any of these posts before publishing.
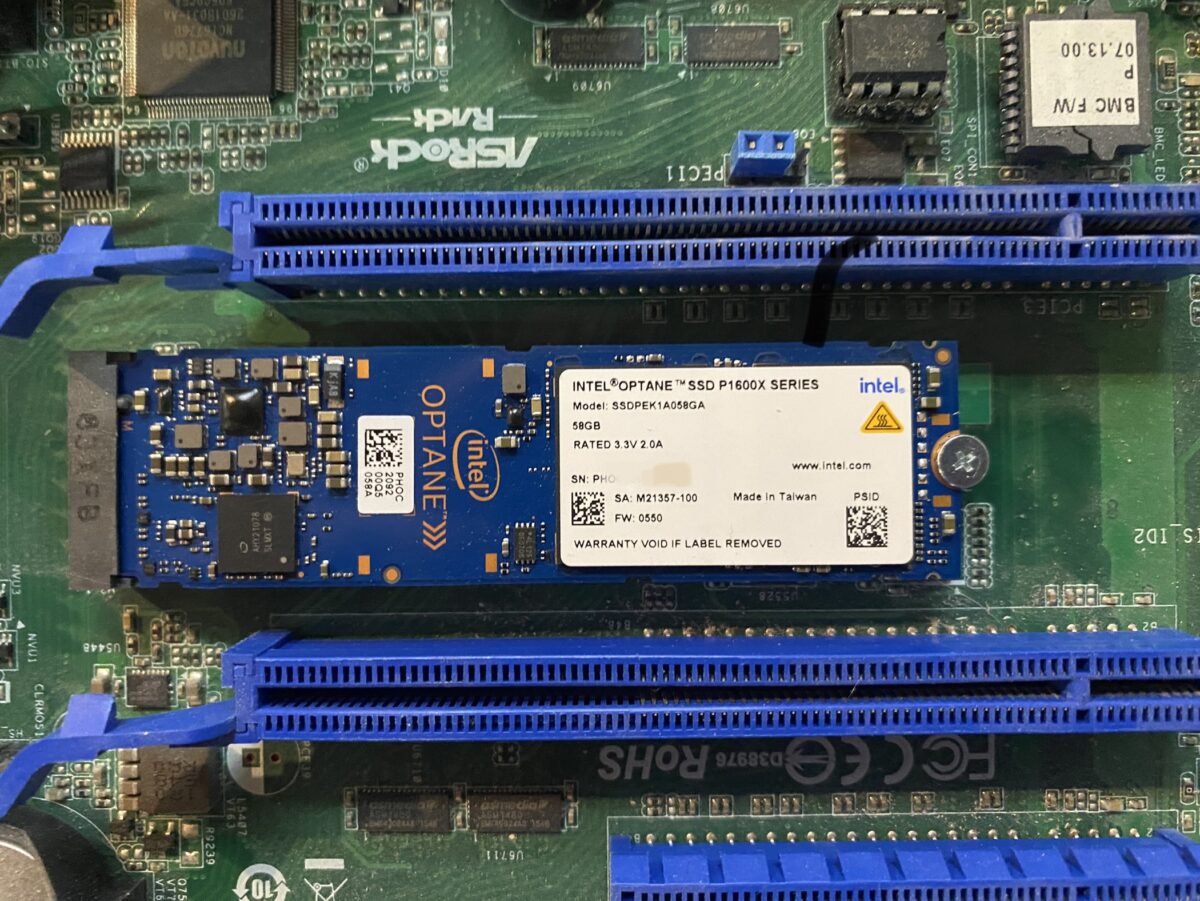
Intel Optane DC P1600X 58GB M.2
The Intel P1600X placed in the first M.2 slot of the AsrockRack EPC612D8
Intel Optane DC P4800X 375GB AIC
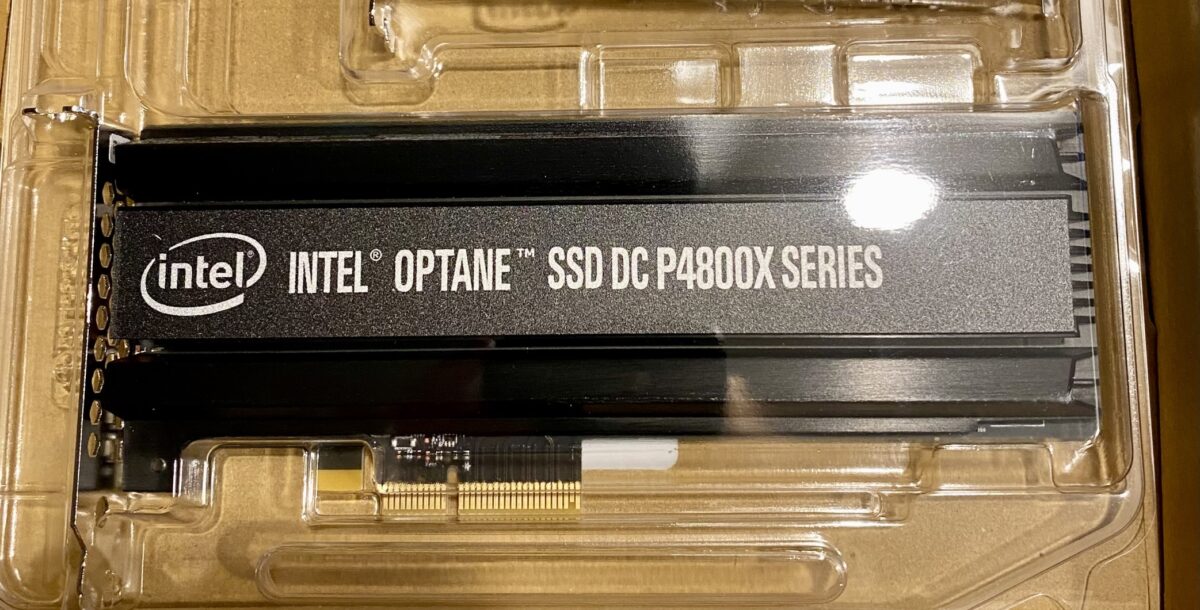
This drive is “face down” when installed so here’s a picture of it on my desk in its shipping tray. The other side is populated with many memory chips.
Intel P4800X in tray
TrueNAS diskinfo for Intel P1600X
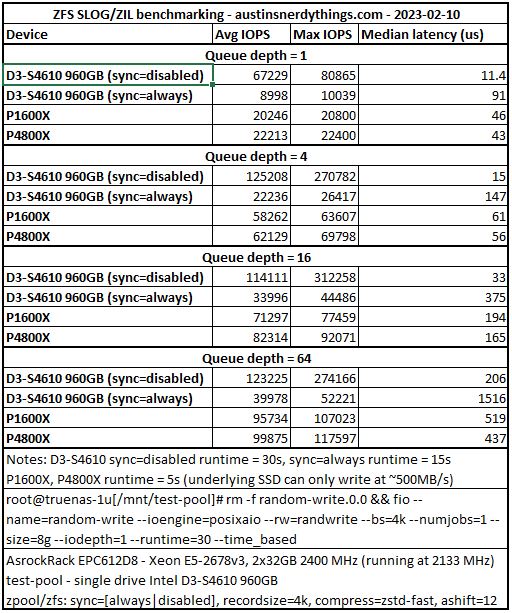
I wanted to re-run this test in a machine where the M.2 slot wasn’t limited to x1 lane width. The results are far better, even for latency, which I wasn’t expecting. For 4k size, the latency is 13.6 microseconds per write. This calculates out to 71.8 kIOPS, which is great for this simple test (I believe it is QD=1). In the Xeon D-1541 machine with a x1 M.2 slot, the latencies were roughly double, and the throughput topped out at 374 MB/s. Quick comparison: spinning hard drives typically have sync write latencies in the 13 millisecond range, meaning the Optane gets writes committed 1000x faster than spinning hard drives.
The P4800X was also faster in the Xeon E5-2678v3 machine – with latencies 8-10% better and throughput up to 270MB/s faster. Makes me wonder what an even faster machine could do. The v3 stuff is getting quite old at this point, but still excellent value for homelab usage.
The 4k latency is 14.1 microseconds, which is curiously 0.5 us slower than the P1600X. Every other size was both quicker and faster.
I varied runtime (between 5 and 30s – 30s for the fast tests is limited by the single disk write speed of ~500MB/s, so I reduced the time to the default txg commit time of 5s) and iodepth (1, 4, 16, 64).
I’m just going to copy + paste (and link to) the Excel table I created since there I don’t really have a good way to do tables in my current WordPress install.
ZFS benchmark results with Intel Optane P1600X & P4800X
Conclusion
These P1600X drives are very, very quick with their 4k write latencies in the low teens. With the recent price drops, and the increasing prevalence of M.2 slots in storage devices, adding one as a SLOG is a super-cheap method to drastically improve sync write performance. I am always on eBay trying to find used enterprise drives with high performance to price ratios and I think this one tops the charts (Amazon link: P1600X 118GB M.2). The write endurance is plenty high for many use cases at 1.3PB (ServeTheHome.com highlights that recycled data center SSDs rarely have more than 1PB written in their article Used enterprise SSDs: Dissecting our production SSD population). The fact that this M.2 doesn’t take a full drive bay makes it even more appealing for storage chassis with only 4 drive bays.
Disclosure: When you click on links to various merchants in this post and make a purchase, this can result in this site earning a commission. Affiliate programs and affiliations include, but are not limited to, the eBay Partner Network.
I’ve been meaning to type this post up for a couple months, but with a 7 month old and a 29 month old at home, a new job, and a half-renovated basement, it took a bit of a back seat.
First question you may have:
What is ZFS?
ZFS stands for ‘zettabyte file system’. It has a long history that started in the early 2000s as part of Sun Microsystem’s Solaris operating system. Since then, it has undergone a decent glow-up, broke free of Oracle/Sun licensing via a rebranding as OpenZFS (I will not pretend to know half the details of how this happened) and is now a default option in at least two somewhat mainstream operating systems (Ubuntu 20.04+ and Proxmox). It just so happens that those are the two primary Linux-based operating systems I use. It also just so happens that I use ZFS as my main filesystem for all of my Proxmox hosts, as well as my network storage systems running FreeNAS/TrueNAS core.
Why do I use ZFS?
A huge benefit of ZFS is data integrity. Long story very short, each block written to disk is written with a checksum. That checksum is checked upon reading, and if it doesn’t match, ZFS knows that the data became corrupted somewhere between writing it to disk, and reading it back (could be an issue with disk, cables, disk controller, or even a flipped bit from a cosmic ray). Luckily, ZFS has a variety of options that make this a non-issue. For anything important, I do at least a mirror, meaning two disks with the same exact data written to each. If a checksum is invalid from one disk, the other is tried. If the other checks out, the first is corrected. ZFS also run a “scrub” at regular intervals (default is usually monthly), where it will read every single block in a pool and verify the checksums for integrity. This prevents bitrot (the tendency for data to go bad if left sitting for years). I will admit, none of my data is super super important but I like to pretend it is.
Performance of ZFS
ZFS can be extremely performant, if the right hardware is used. A trade-off of the excellent data integrity is the overhead involved with checksums and all that jazz. ZFS is also a copy-on-write filesystem, which means snapshots are instant, and blocks aren’t changed – just the reference to the block. Where things get slow is when you have a pool of spinning, mechanical hard drives, and you request sync writes, meaning that ZFS will not say the write is completed until it is safely committed to disk. That takes 8-15 milliseconds for spinning disks. 8-15 milliseconds may not seem like a long time, but it is an eternity compared to CPU L1/L2/L3 cache and a tenth (don’t quote me on that) of an eternity compared to fast NVMe SSDs. To overcome to latency of mechanical disk access, loads of people think, “Oh I can just slap in this old SSD from my last build as a read/write cache and call it good”. That’s what we’ll examine today.
Benchmarking ZFS sync writes
The test system is something I picked up from r/homelabsales a few months ago for $150 in a Datto case. I figured that compared to current Synology/QNAP 4-bay NAS devices, it was 1) a steal, and 2) far more capable:
I stopped at 2x 4TB WD Reds instead of four so I could easily swap different SSDs into one of the other bays for benchmarking. I figure a basic 2 HDD mirror is decently close to many r/homelab setups. Of course, performance will roughly double for the base zpool if another mirror is added.
The guy on homelabsales had a bunch of similarly spec’d systems, all of which sold for very cheap – let me know if you got one!
The fio command used
fio is a standard benchmarking tool. I kept it simple and used the same script for each test. The following does random writes, with a 4k byte size to test IOPS instead of pure bandwidth/throughput, IO depth of 1, 30 second duration, and sync after each write.
Note: I set sync=always on the dataset, so I’m not specifying –fsync=1 here.
Note 2: iodepth=16 is a bit strong for home situations, but I’ve already redone this benchmark series twice so not doing it again with qd=1 for every drive. QD=1 is covered for the 3 fastest drives at the end
The Intel devices were graciously provided by Intel with no expectation other than running some benchmarks on them. Apparently their Optane business is winding down, which is unfortunate because it is an amazing technology. ServeTheHome.com has confirmed the P4800X AIC form-factor is being discontinued.
A short word on “write cache” for ZFS – go read read Jim Salter’s ZFS sync/async ZIL/SLOG guide. He is a ZFS expert and has written many immensely helpful guides on it. Long story short, a SLOG is a write cache device, but only for sync writes. It needs to have consistent, low latency to function well. Old enterprise SSDs are ideal for this.
FreeBSD’s diskinfo command results
I briefly wanted to show the diskinfo results for the Intel devices:
Intel Optane P4800X 375GB
This is the single most expensive piece of computer hardware I’ve ever held in my own hands – the Intel Optane SSD DC P4800X 375GB in the AIC (PCIe) form-factor.
Bottoms out at 15 microseconds per IO for 259.6 MB/s at 4k blocksize. This is extremely fast, and is considered to be one of the best SLOG devices currently available (top 5 easily). Make no mistake, the Intel P4800X is one of the highest performing solid state drives in existence. Here’s a quote from the StorageReview.com review of the device: “For low-latency workloads, there is currently nothing that comes close to the Intel Optane SSD DC P4800X.”
There are a few form factors available, with price tags to match:
The P4800X’s little brother is no slouch. In fact, it is quicker latency-wise than any SATA and SAS SSD currently in existence. The diskinfo shows that in a slightly more capable system (Xeon E5-2678v3, 2x32GB 2133 MHz, ASRock EPC612D8), the latency is even lower than in the P4800X. The latency is an astounding 13.3 microseconds per IO at 4k size. These are now available on Amazon (as a 118GB version) for $88 as of writing – Intel Optane P1600X 118GB M.2. Note: the original version of this post had the numbers from a P1600X in a M.2 slot limited to a single PCIe lane (x1). The below numbers are from a full x4 slot.
The base topology of the zpool is a simple mirrored pair of WD Reds.
root@truenas-datto[~]# zpool create -o ashift=12 bench-pool mirror /dev/da1 /dev/da3
root@truenas-datto[~]# zfs set recordsize=4k bench-pool
root@truenas-datto[~]# zfs set compress=lz4 bench-pool
root@truenas-datto[~]# zfs set sync=always bench-pool
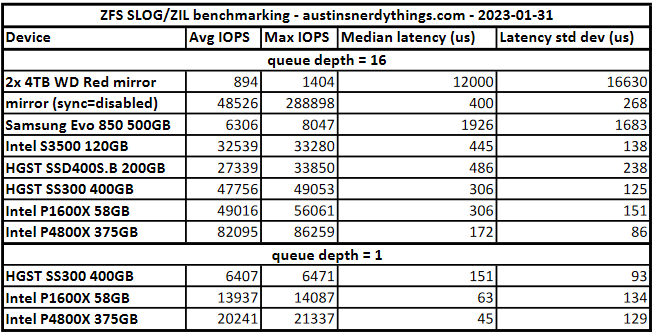
Base 2x 4TB WD Red Results
With sync write speeds: 894 IOPS, 3.6MB/s. It is 2023 – do not use uncached mechanical hard drives for sync workloads. Median completion latency of 12 milliseconds, average of 17.8 milliseconds.
This effectively tests how fast the pool can write without consideration for sync writes. They are essentially buffered in memory (in the ZIL – ZFS intent log) and flushed every 5 seconds by default to disk.
IOPS = 48.3k, median latency = 400 microseconds, avg latency = 321 microseconds. Note that the max IOPS recorded was 288.8k, which was likely for the first few seconds as the ZIL filled up. As the ZIL started to flush to disk, the writes slowed down to keep pace with the slowness of the disks writing. This figure is the maximum this system can generate, regardless of what disks are used.
This was a very popular SSD a few years ago, with great performance per dollar when it was release. This was the 2nd SSD I ever bought (first was a Crucial M4 256GB).
IOPS = 6306, median latency = 1.9 milliseconds, avg latency = 2.5 ms, standard deviation = 1.6 ms. These are not great performance numbers. Consumer drives typically don’t deal well with high queue depth operations.
This was the first enterprise SSD I acquired for use in my homelab. I bought two, for a read/write cache on my Xpenology machine (DSM requires 2 drives to mirror for write cache). The datasheet indicates write latency of 65 us, which is pretty quick. Much faster than the 1900 us median latency of the Evo 850 in the previous section. Unfortunately for the 120GB drives, sequential writes are indicated at 135 MB/s, which is fine for gigabit filesharing. These drives (and many, many other “enterprise” SSDs) feature capacitors for power loss protection. The drive can acknowledge the writes very quick because the capacitors store enough energy for the drive to commit writes to NAND in the event of a power loss.
IOPS = 32.5k, median latency = 437 us, 5x faster than the Evo 850. Standard deviation = 0.14 ms, 10x more consistent than the Evo 850.
This is a SAS2 SSD with SLC NAND, and power loss protection. It has a rated endurance of 18 petabytes. This is effectively infinite write endurance for any home use situation (and even many enterprise/commercial use situations).
IOPS = 27.4k, median latency = 486 us, standard dev = 238 us. Very good numbers.
This is a more modern SAS3 MLC SSD, spec’d for write-intensive use cases. As far as I can tell, this drive is about as close to NVMe performance as you can get from a SAS3 interface per the datasheet specs (200k IOPS, 2050 MB/s throughput, 85 us latency max). Endurance is 10 drive writes per day for 5 years, which is 7.3 PB.
Our pool now does 43.0k IOPS (max 49.8k), with a median sync latency of 306 us, standard dev of 244 us
This is one of the drives sent to me by Intel. Optane is not NAND technology. I don’t really keep up on the details of persistent storage details, so you’ll have to look up specifics. What I do know, is the technology allows for much faster writes, in terms of latency. At the top end, the throughput isn’t as high as modern NVMe, but the latency is much quicker at low queue depths. As a reminder, all the tests so far are with queue depth = 16. At these queue depths, Optane doesn’t look as fast as it really is, unless you’re working with the P1600X’s big brother (next section).
IOPS = 39.2k (max 57.6k), median latency = 322 us, std dev = 385 us.
This is the other drive that Intel sent me. This drive is fast. Many review sites use verbiage such as “this drive has no comparison” or “this is the fastest drive we’ve ever tests”.
My first test was for 30 seconds. I realized the drive was doing it’s thing (caching sync writes) much faster than the HDD mirror could flush to disk. Regardless, the initial results are below. Note the max IOPS of 84.6k.
Recall that the default txg flush interval is 5 seconds. I used a test of 10 seconds, thinking that the SLOG will cache writes for up to 5 seconds, and for the next 5 seconds, the disks are constantly writing the cache to disk while the SLOG is still ingesting writes.
HGST SS300 – 10 second test
IOPS = 47.7k (max = 49.0k), median latency = 306 us, std dev = 125 us
IOPS = 80.7k (max = 86.3k, so might still be hitting HDD mirror limits), median latency = 172 us, std dev = 86 us. These numbers are fantastic, especially for 4k blocksize. The throughput is 331MB/s. You will have a hard time getting your hands on a faster device unless you have $xx,xxx to spend.
Where the Optane drives really shine is with low queue depth operations. I reran the tests with QD=1 (5 second test to simulate a burst of writes) for the P4800X, the P1600X, and the SS300.
P4800X queue depth = 1
IOPS = 20.2k, median latency = 45 us, std dev = 129 us.
Last test, using a P1600X as a ZFS special allocation device (special vdev)
The Intel engineer I was working with requested I demonstrate the potential of a P1600X as a ZFS special allocation device (special device/special vdev). They did not have a specific test in mind. A special device stores metadata about the files on the pool, and can additionally store small blocks (as set with the special_small_blocks property of the dataset). If you set special_small_blocks to 16k, for example, any file that is smaller than 16k will be written to the special device directly instead of the main pool disks. As you might imagine, this can really speed up transfers of small files. Note: since the special device stores all metadata about data on the pool, and potentially data itself, it is critical that it is at least a mirror (some use 3-way mirrors). If you lose the special device vdev, you lose the entire pool! Since I am just benchmarking, I do not have a mirrored special vdev. I can remove it whenever I want since the underlying pool is comprised of mirrors.
The test procedure is as follows:
Reboot machine to clear ARC
Run a command that reads metadata for every file on a dataset. The specific command prints out a distribution of file sizes, which I then used to calculate what I should use for special_small_blocks.
Note the time it took to run said command
Wipe pool
Add special device to pool
Transfer all data back to pool
Rerun command and note time difference.
The “wipe pool” and “transfer all data back to pool” steps make this test something you don’t want to repeat (as with many other ZFS things, such as changing compression type or recordsize, special device metadata is only written upon writes. it will not backfill).
Command used to for special_small_blocks calculation
find . -type f -print0 | xargs -0 ls -l | awk '{ n=int(log($5)/log(2)); if (n<10) { n=10; } size[n]++ } END { for (i in size) printf("%d %d\n", 2^i, size[i]) }' | sort -n | awk 'function human(x) { x[1]/=1024; if (x[1]>=1024) { x[2]++; human(x) } } { a[1]=$1; a[2]=0; human(a); printf("%3d%s: %6d\n", a[1],substr("kMGTEPYZ",a[2]+1,1),$2) }'
It prints out a list of sizes and how many entites are in that size bin. I threw ‘time’ in front to see how long it takes to run. I ran it once for each dataset. This is my media dataset (movies, music, tv shows, etc.)
root@truenas-datto[/mnt/test-pool/share-media]# time find . -type f -print0 | xargs -0 ls -l | awk '{ n=int(log($5)/log(2)); if (n<10) { n=10; } size[n]++ } END { for (i in size) printf("%d %d\n", 2^i, size[i]) }' | sort -n | awk 'function human(x) { x[1]/=1024; if (x[1]>=1024) { x[2]++; human(x) } } { a[1]=$1; a[2]=0; human(a); printf("%3d%s: %6d\n", a[1],substr("kMGTEPYZ",a[2]+1,1),$2) }'
  1k:  14336
  2k:    759
  4k:   1194
  8k:   4188
 16k:   5609
 32k:   3498
 64k:   2882
128k:    552
256k:    194
512k:    103
  1M:     58
  2M:      6
  4M:      2
  8M:     14
 16M:     98
 32M:    253
 64M:    793
128M:   1130
256M:    529
512M:    322
  1G:    185
  2G:     60
  4G:      9
  8G:      3
 16G:      1
find . -type f -print0  0.15s user 2.10s system 6% cpu 37.210 total
xargs -0 ls -l  1.23s user 0.24s system 3% cpu 37.213 total
awk   0.07s user 0.02s system 0% cpu 37.213 total
sort -n  0.00s user 0.00s system 0% cpu 37.213 total
awk   0.00s user 0.00s system 0% cpu 37.212 total
37.2 seconds total to run.
And on my ‘data’ dataset (backups, general file storage, etc.):
root@truenas-datto[/mnt/test-pool/share-data]# time find . -type f -print0 | xargs -0 ls -l | awk '{ n=int(log($5)/log(2)); if (n<10) { n=10; } size[n]++ } END { for (i in size) printf("%d %d\n", 2^i, size[i]) }' | sort -n | awk 'function human(x) { x[1]/=1024; if (x[1]>=1024) { x[2]++; human(x) } } { a[1]=$1; a[2]=0; human(a); printf("%3d%s: %6d\n", a[1],substr("kMGTEPYZ",a[2]+1,1),$2) }'
  1k: 106714
  2k:  23595
  4k:  20593
  8k:  25994
 16k:  20264
 32k:  28506
 64k:  28759
128k:  26909
256k:  20027
512k:  19708
  1M:  24780
  2M:  34587
  4M:  20427
  8M:  15888
 16M:   2388
 32M:    983
 64M:    558
128M:    272
256M:    260
512M:    179
  1G:     93
  2G:     69
  4G:     36
  8G:     17
 16G:      5
 32G:      1
128G:      4
256G:      1
find . -type f -print0  0.36s user 5.46s system 3% cpu 2:43.07 total
xargs -0 ls -l  10.46s user 2.55s system 7% cpu 2:43.13 total
awk   0.78s user 0.02s system 0% cpu 2:43.13 total
sort -n  0.00s user 0.00s system 0% cpu 2:43.13 total
awk   0.00s user 0.00s system 0% cpu 2:43.13 total
2m43s. We have a baseline.
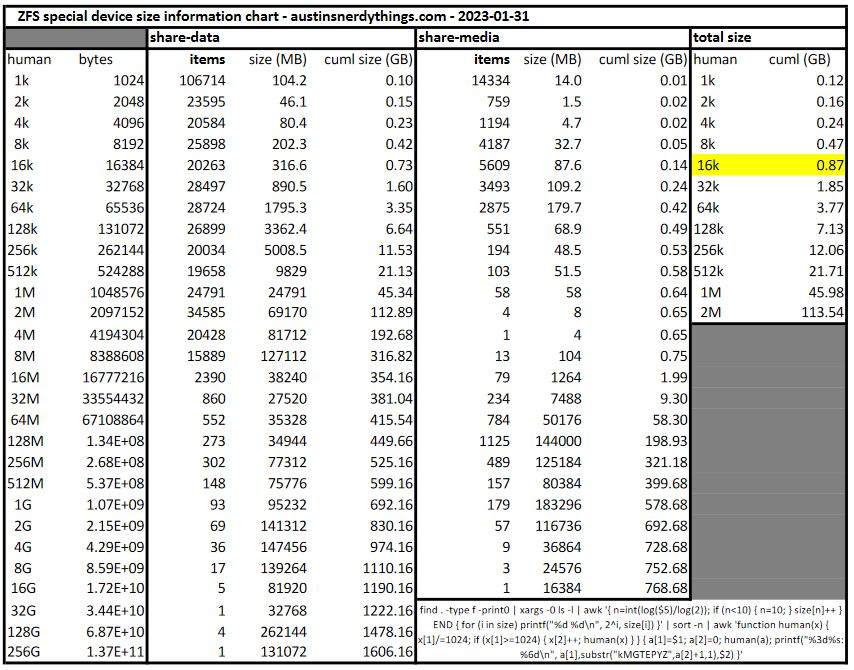
I also threw together a spreadsheet to do a cumulative sum on how much space is used by each bin. I decided to go with 16k, which should only use 0.87 GB of the 58 GB Optane P1600X for small files.
ZFS Special device size calculation spreadsheet table. Link to .xlsx file below.
Rebuilding the pool with a special allocation device
I use syncoid exclusively to synchronize ZFS pools across machines/systems. Sanoid generates the snapshots. These are great tools written by Jim Salter. I transferred with option special_small_blocks=16k so the property was set immediately. Syncoid won’t write to an empty, already created dataset. It took a while to transfer 3.7TB, even over a 10G link.
-- add 2x more WD Reds, wipe pools, recreate pools, remove p1600x as slog, re-add as special dev
root@truenas-datto[~]# zpool destroy bench-pool

zpool create -o ashift=12 test-pool mirror /dev/da0 /dev/da1 mirror /dev/da2 /dev/da3
zpool add -f test-pool special /dev/nvd1

root@truenas-datto[~]# smartctl -a /dev/nvme1
=== START OF INFORMATION SECTION ===
Model Number:                       INTEL SSDPEK1A058GA
Serial Number:                      PHOC209200KC058A

root@truenas-datto[~]# zpool status test-pool
  pool: test-pool
 state: ONLINE
config:

        NAME        STATE     READ WRITE CKSUM
        test-pool   ONLINE       0     0     0
          mirror-0  ONLINE       0     0     0
            da0     ONLINE       0     0     0
            da1     ONLINE       0     0     0
          mirror-1  ONLINE       0     0     0
            da2     ONLINE       0     0     0
            da3     ONLINE       0     0     0
        special
          nvd1      ONLINE       0     0     0

errors: No known data errors

syncoid --no-sync-snap --recvoptions="o special_small_blocks=16k" [email protected]:big/share-media test-pool/share-media
root@truenas-datto[~]# zfs get special_small_blocks test-pool/share-media
NAME                   PROPERTY              VALUE                 SOURCE
test-pool/share-media  special_small_blocks  16K                   local

-----------------------------------------------------------------------------------------------------------------------------
-- NOTE: this zpool list was captured approximately 1 minute into the data transfer, hence why the nvd1 ALLOC is only 24.7M -
-----------------------------------------------------------------------------------------------------------------------------
root@truenas-datto[~]# zpool list -v test-pool
NAME           SIZE  ALLOC   FREE  CKPOINT  EXPANDSZ   FRAG    CAP  DEDUP    HEALTH  ALTROOT
test-pool     7.30T  15.1G  7.29T        -         -     0%     0%  1.00x    ONLINE  /mnt
  mirror-0    3.62T  7.22G  3.62T        -         -     0%  0.19%      -    ONLINE
    da0       3.64T      -      -        -         -      -      -      -    ONLINE
    da1       3.64T      -      -        -         -      -      -      -    ONLINE
  mirror-1    3.62T  7.87G  3.62T        -         -     0%  0.21%      -    ONLINE
    da2       3.64T      -      -        -         -      -      -      -    ONLINE
    da3       3.64T      -      -        -         -      -      -      -    ONLINE
special           -      -      -        -         -      -      -      -  -
  nvd1        54.9G  24.7M  54.5G        -         -     0%  0.04%      -    ONLINE
Special device metadata reading results
The same command as before for the ‘media’ dataset:
root@truenas-datto[/mnt/test-pool/share-media]# time find . -type f -print0 | xargs -0 ls -l | awk '{ n=int(log($5)/log(2)); if (n<10) { n=10; } size[n]++ } END { for (i in size) printf("%d %d\n", 2^i, size[i]) }' | sort -n | awk 'function human(x) { x[1]/=1024; if (x[1]>=1024) { x[2]++; human(x) } } { a[1]=$1; a[2]=0; human(a); printf("%3d%s: %6d\n", a[1],substr("kMGTEPYZ",a[2]+1,1),$2) }'
  1k:  14336
  2k:    759
  4k:   1194
 ...
  4G:      9
  8G:      3
 16G:      1
find . -type f -print0  0.14s user 1.53s system 51% cpu 3.254 total
xargs -0 ls -l  1.22s user 0.23s system 43% cpu 3.370 total
awk   0.08s user 0.00s system 2% cpu 3.370 total
sort -n  0.00s user 0.00s system 0% cpu 3.370 total
awk   0.00s user 0.00s system 0% cpu 3.369 total
And for the ‘data’ dataset:
root@truenas-datto[/mnt/test-pool/share-media]# cd ../share-data
root@truenas-datto[/mnt/test-pool/share-data]# time find . -type f -print0 | xargs -0 ls -l | awk '{ n=int(log($5)/log(2)); if (n<10) { n=10; } size[n]++ } END { for (i in size) printf("%d %d\n", 2^i, size[i]) }' | sort -n | awk 'function human(x) { x[1]/=1024; if (x[1]>=1024) { x[2]++; human(x) } } { a[1]=$1; a[2]=0; human(a); printf("%3d%s: %6d\n", a[1],substr("kMGTEPYZ",a[2]+1,1),$2) }'
  1k: 106714
  2k:  23595
  4k:  20593
 ...
 32G:      1
128G:      4
256G:      1
find . -type f -print0  0.24s user 3.80s system 24% cpu 16.282 total
xargs -0 ls -l  10.29s user 2.39s system 77% cpu 16.345 total
awk   0.78s user 0.02s system 4% cpu 16.345 total
sort -n  0.00s user 0.00s system 0% cpu 16.345 total
awk   0.00s user 0.00s system 0% cpu 16.345 total
To summarize the special device metadata access times (all times in seconds), it reduced the amount of time required to traverse all file metadata by 90%. That said, there was a similar reduction if I ran the command multiple times in a row without a special vdev due to ZFS’ ARC caching the metadata. It would be trivial to write a cron task that would iterate over files on a regular basis to keep that data in ARC as frequently accessed data.
share-media
share-data
no special vdev (s)
37.2
163.07
with special vdev (s)
3.25
16.28
delta (s)
-33.95
-146.79
delta %
-91.3%
-90.0%
Special device size utilization
As far as I can tell, there isn’t really a good way to calcuate how much space will be used by the special device storing metadata and such. In my case, 3.74TB of data with special_small_blocks=16k resulted in 11.9GB being used on the special device:
If you’ve made it this far, congrats. I didn’t intend to write this many words on ZFS benchmarks but here we are. Hopefully you found this data interesting/insightful and/or learned something from it. At a minimum, you should now be able to calculate how much space you need if you want to utilize a special vdev. Also special thanks to Intel for sending me Optane samples to play around with and benchmark.
Here’s a table with a summary of the results:
ZFS SLOG/ZIL benchmarks for select devices
Please let me know in the comments of this post if you’d like me to re-run any benchmarks, or have any questions/comments/concerns about the process!
Disclosure: When you click on links to various merchants in this post and make a purchase, this can result in this site earning a commission. Affiliate programs and affiliations include, but are not limited to, the eBay Partner Network.
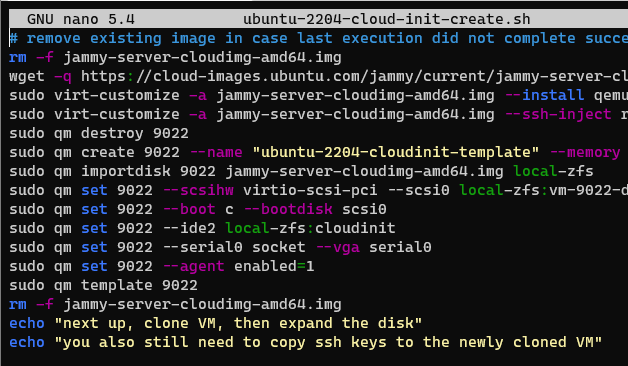
Been a while since I last posted. For basically everything I do Linux-wise, I use Ubuntu. Specifically the Long Term Support versions, which are released on even years in April (April 2020, April 2022, etc.), hence the 22.04 designation of the latest LTS, Jammy. I had standardized on 20.04 (Focal) for everything, but am finding that various packages I use that I expect to be available on 20.04, aren’t. But they are present in standard, default package lists for Jammy 22.04. Last night I was creating a new VM to transfer this very blog to my shiny, new co-located server. I was going to use the Ubuntu 20.04 Proxmox Cloud Init Image Script template I wrote up a bit ago. Then I stopped and realized I should update it. So I changed 2004 everywhere in the script to 2204 and ‘focal’ to ‘jammy’, reran it, and now I have a fancy new cloud init script for Ubuntu 22.04. Note that this script does require you to install libguestfs-tools, as indicated in the previous cloud-init post.
ChatGPT enhanced script as of 2023:
#!/bin/bash

##############################################################################
# things to double-check:
# 1. user directory
# 2. your SSH key location
# 3. which bridge you assign with the create line (currently set to vmbr100)
# 4. which storage is being utilized (script uses local-zfs)
##############################################################################

DISK_IMAGE="jammy-server-cloudimg-amd64.img"
IMAGE_URL="https://cloud-images.ubuntu.com/jammy/current/$DISK_IMAGE"

# Function to check if a file was modified in the last 24 hours or doesn't exist
should_download_image() {
    local file="$1"
    # If file doesn't exist, return true (i.e., should download)
    [[ ! -f "$file" ]] && return 0

    local current_time=$(date +%s)
    local file_mod_time=$(stat --format="%Y" "$file")
    local difference=$(( current_time - file_mod_time ))
    # If older than 24 hours, return true
    (( difference >= 86400 ))
}

# Download the disk image if it doesn't exist or if it was modified more than 24 hours ago
if should_download_image "$DISK_IMAGE"; then
    rm -f "$DISK_IMAGE"
    wget -q "$IMAGE_URL"
fi

sudo virt-customize -a "$DISK_IMAGE" --install qemu-guest-agent
sudo virt-customize -a "$DISK_IMAGE" --ssh-inject root:file:/home/austin/id_rsa.pub

if sudo qm list | grep -qw "9022"; then
    sudo qm destroy 9022
fi

sudo qm create 9022 --name "ubuntu-2204-cloudinit-template" --memory 2048 --cores 2 --net0 virtio,bridge=vmbr100
sudo qm importdisk 9022 "$DISK_IMAGE" local-zfs
sudo qm set 9022 --scsihw virtio-scsi-pci --scsi0 local-zfs:vm-9022-disk-0
sudo qm set 9022 --boot c --bootdisk scsi0
sudo qm set 9022 --ide2 local-zfs:cloudinit
sudo qm set 9022 --serial0 socket --vga serial0
sudo qm set 9022 --agent enabled=1
sudo qm template 9022

echo "Next up, clone VM, then expand the disk"
echo "You also still need to copy ssh keys to the newly cloned VM"
Original, non-ChatGPT script:
###############
# things to double-check:
# 1. user directory
# 2. your SSH key location
# 3. which bridge you assign with the create line (currently set to vmbr100)
# 4. which storage is being utilized (script uses local-zfs)
###############

rm -f jammy-server-cloudimg-amd64.img
wget -q https://cloud-images.ubuntu.com/jammy/current/jammy-server-cloudimg-amd64.img
sudo virt-customize -a jammy-server-cloudimg-amd64.img --install qemu-guest-agent
sudo virt-customize -a jammy-server-cloudimg-amd64.img --ssh-inject root:file:/home/austin/id_rsa.pub
sudo qm destroy 9022
sudo qm create 9022 --name "ubuntu-2204-cloudinit-template" --memory 2048 --cores 2 --net0 virtio,bridge=vmbr100
sudo qm importdisk 9022 jammy-server-cloudimg-amd64.img local-zfs
sudo qm set 9022 --scsihw virtio-scsi-pci --scsi0 local-zfs:vm-9022-disk-0
sudo qm set 9022 --boot c --bootdisk scsi0
sudo qm set 9022 --ide2 local-zfs:cloudinit
sudo qm set 9022 --serial0 socket --vga serial0
sudo qm set 9022 --agent enabled=1
sudo qm template 9022
rm -f jammy-server-cloudimg-amd64.img
echo "next up, clone VM, then expand the disk"
echo "you also still need to copy ssh keys to the newly cloned VM"
Proxmox Ubuntu 22.04 cloud-init image script
I suppose for a full automation I should get user with a whoami command, assign it to a variable, and use that throughout the script. That’s a task for another day.
I also added a line in my crontab to have this script run weekly, so the image is essentially always up to date. I’ll run both 20.04 and 22.04 in parallel for a bit but anticipate that I can turn off the 20.04 job fairly soon.
# m h  dom mon dow   command
52 19 * * TUE sleep $(( RANDOM \% 60 )); /usr/bin/bash /home/austin/ubuntu-2004-cloud-init-create.sh >> /home/austin/ubuntu-template.log 2>&1
52 20 * * TUE sleep $(( RANDOM \% 60 )); /usr/bin/bash /home/austin/ubuntu-2204-cloud-init-create.sh >> /home/austin/ubuntu-2204-template.log 2>&1
I have finally started actual work on a “Tinder for restaurants” that I’m calling MonchMatch. I’ve been tossing the idea around for a few months but have finally made some moves with outsourcing the design. I can get the app and backend going myself, but I have zero creative talent.
If you are or know anyone who wants to work on the design, please drop me a note.
If you’re interested in being notified when MonchMatch is released, head on over to the MonchMatch site and enter your email!
Sometimes I make a change to my Proxmox cluster configuration without all nodes in a healthy state (i.e. they are off). This isn’t a great habit to get into and sometimes results in troubleshooting.
Putting a quick post up so I can easily reference how to resolve corosync issues.
# stop corosync and pmxcfs on all nodes
$ systemctl stop corosync pve-cluster

# start pmxcfs in local mode on all nodes
$ pmxcfs -l

# put correct corosync config into local pmxcfs and corosync config dir (make sure to bump the 'config_version' inside the config file)
$ cp correct_corosync.conf /etc/pve/corosync.conf
$ cp correct_corosync.conf /etc/corosync/corosync.conf

# kill local pmxcfs
$ killall pmxcfs

# start corosync and pmxcfs again
$ systemctl start pve-cluster corosync

# check status
$ journalctl --since '-5min' -u pve-cluster -u corosync
$ pvecm status